Ripple Price Analysis: XRP Hesitates But Further Gains Likely
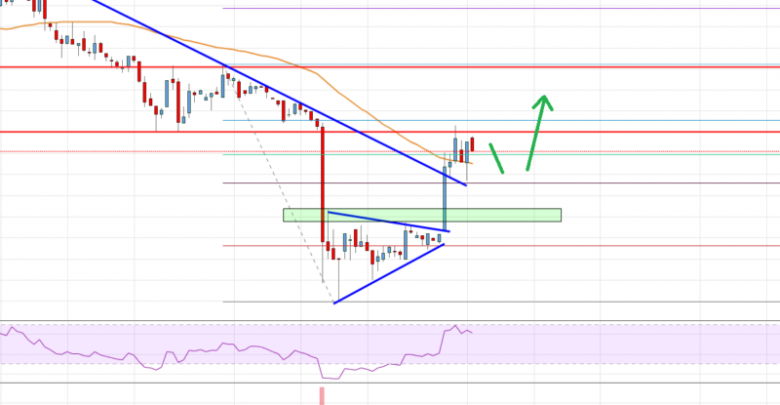
- Ripple price started a strong recovery after trading as low as $0.2498 against the US dollar.
- The price is currently trading with a positive angle above the $0.2700 pivot level.
- Recently, there was a break above a major bearish trend line with resistance at $0.2805 on the 4-hours chart of the XRP/USD pair (data source from Bittrex).
- The price is now facing a crucial resistance near the $0.2900 and $0.3000 levels.
Ripple price is gaining bullish momentum above $0.2800 against the US Dollar. However, XRP price must surpass the $0.2900 resistance to continue higher in the near term.
Ripple Price Analysis
This past week, there was a sharp drop in bitcoin, Ethereum, bitcoin cash, ADA and ripple against the US Dollar. The XRP/USD pair traded below the key $0.3000 and $0.2850 support levels. Moreover, there was a close below $0.3000 and the 55 simple moving average (4-hours). The price traded below the $0.2500 level and a new monthly low was formed near $0.2498.
Recently, the price started an upside correction above the $0.2650 and $0.2700 resistance levels. There was a break above the 50% Fib retracement level of the major decline from the $0.3061 high to $0.2498 low. Moreover, there was a break above a major bearish trend line with resistance at $0.2805 on the 4-hours chart of the XRP/USD pair. It opened the doors for more gains above $0.2800 and the 55 simple moving average (4-hours).
However, the price faced a strong resistance near the $0.2900 area (the previous support area). Additionally, the 76.4% Fib retracement level of the major decline from the $0.3061 high to $0.2498 low is acting as a resistance near $0.2925. At the moment, the price is consolidating above the $0.2800 level and 55 simple moving average (4-hours). If there is a successful break above the $0.2925 level, the price could surge higher.
In the mentioned case, the price could even climb above $0.3000 and $0.3060. The next stop for the bulls might be near the $0.3190 level. It represents the 1.236 Fib extension level of the major decline from the $0.3061 high to $0.2498 low. Conversely, if there is a downside correction, the $0.2800 level could play an important role.

Looking at the chart, ripple price is clearly facing a strong resistance near $0.2900 and $0.2925. Therefore, it could either surge above $0.2925 or start a fresh decline. The main support below $0.2800 is near the $0.2700 area.
Technical indicators
4 hours MACD – The MACD for XRP/USD is showing positive signs in the bullish zone.
4 hours RSI (Relative Strength Index) – The RSI for XRP/USD is currently holding the 60 level.
Key Support Levels – $0.2800, $0.2720 and $0.2700.
Key Resistance Levels – $0.2900 and $0.2925.
Source: livebitcoinnews.com
View original post


