
Bitcoin Completes 2-Day $2,000 Plunge: Will The Last Support Hold Before Reaching New 2019 Lows? BTC Price Analysis
In our recent Bitcoin price analysis, we had stated that there are ‘high chances’ to see new lows for Bitcoin below the $11,000 region.
The last 48 hours were a blood bath for Bitcoin, as the cryptocurrency reminded everyone that it’s still a very volatile asset. Losing $2,000 of its value in 48 hours, which is approximately 18%, is not common but not that rare throughout Bitcoin’s history.
There is a lot of panic sell going on: when everyone sees and think of Bitcoin as a hedge, trying to find an inverse correlation between Wall Street and the Bitcoin’s price, then comes a day when Bitcoin plunges 10% amid the 3% losses of Nasdaq.
Another thing to note is about technical analysis. When all the Bitcoin analysts on Twitter and YouTube spoke about the $10,800 “unbreakable” zone – then it just broke down like butter. When everyone expects something, then something else takes place, since the majority of people lose money while trading.
A little hope for Bitcoin
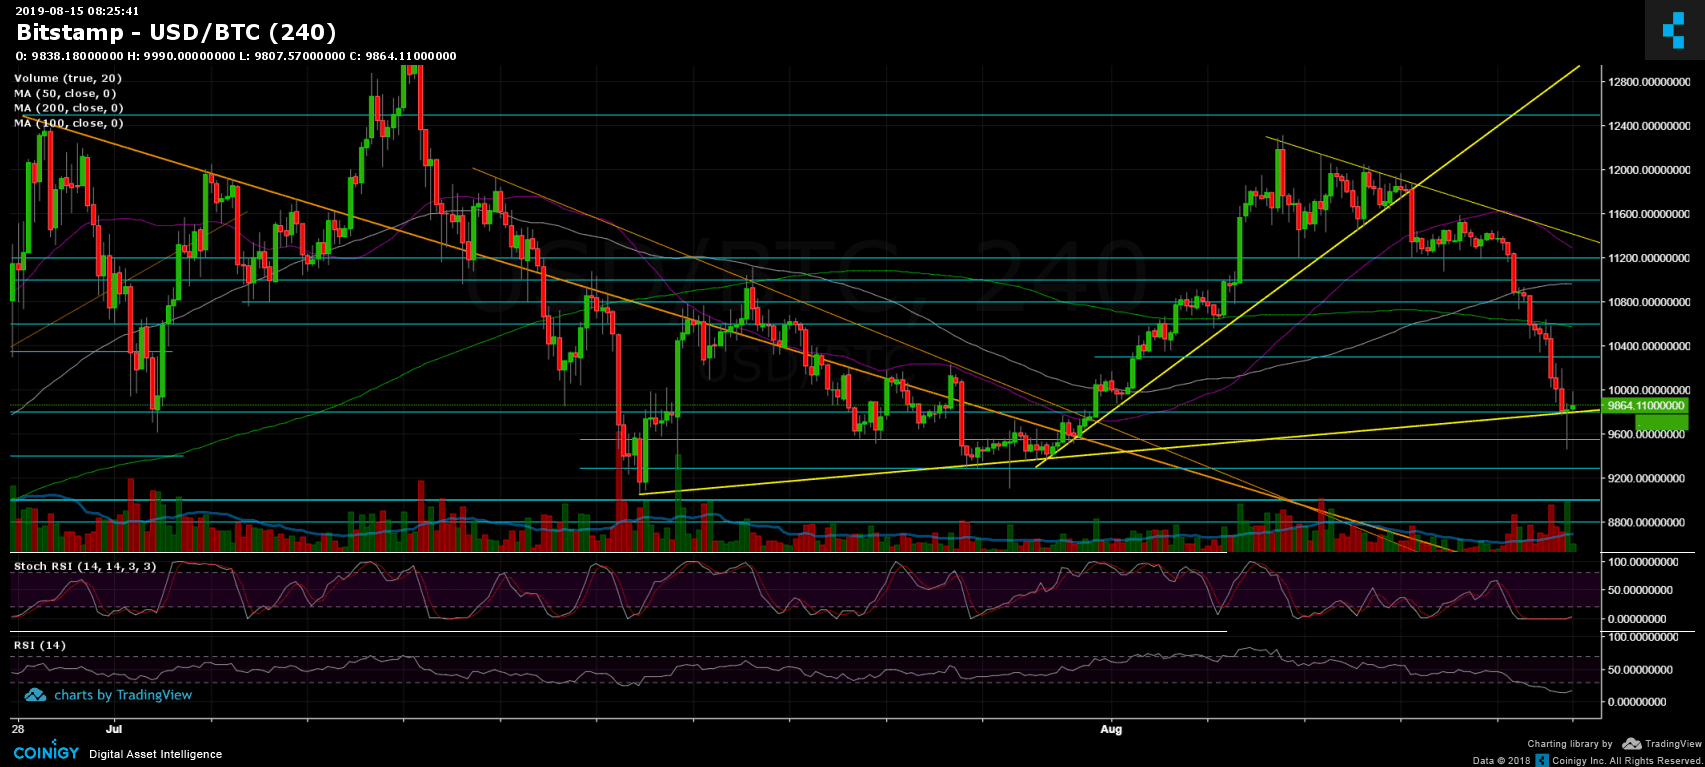
After recording the current daily bottom at $9467 on Bitstamp, we saw Bitcoin’s impressive comeback over the past two hours. As of writing this, the 4-hour candle of the deep just closed in a nice green bullish Doji shape candle, and if it holds up the significant support trend-line (marked yellow), this changes things for the short term, in my opinion.
After going down one way, a price correction was expected. But, will the retest of the $10,000 area from below, end up in confirming the last as resistance? just one stop before another plunge to new lows?
Total Market Cap: $260 billion
Bitcoin Market Cap: $178 billion
BTC Dominance Index: 68.4%
*Data by CoinGecko
Key Levels to Watch
– Support/Resistance:
Following the breakdown, the $10,000 is now the first support turned resistance level. In the case of a break-up, then $10,200 – $10,300 will be the next target, before reaching $10,600 and $10,850 (which contains the significant 50-days moving average line marked purple). Higher above is the $11,000 – $11,200 region.
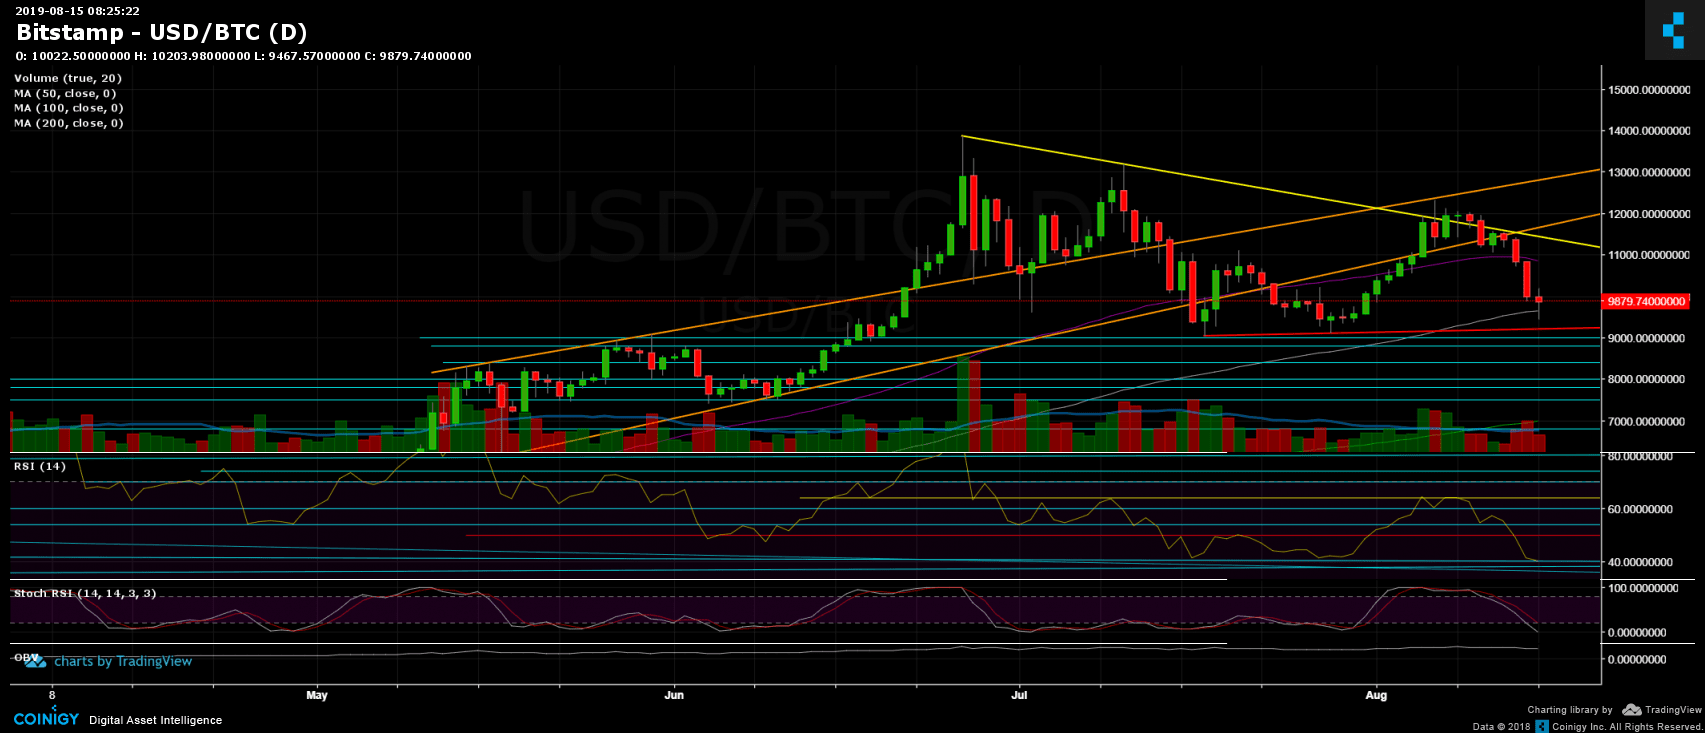
Looking on the bearish side, Bitcoin faces $9600 and $9400 (the current daily low). In case of a breakdown of the last, the last higher-low pattern will be lost in case of breaking down the $9200 level (seen on the 1-day chart by the red line). Below is $9000, $8800 and $8400 – $8500.
– Daily chart’s RSI: Just like Bitcoin, the daily RSI one-way crashed to the 40 support level. As stated here two days ago: “Bitcoin has more room to go lower,” Stochastic RSI is down at the oversold territory, which could turn into some recession of the bleeding.
– Trading Volume: Yesterday’s trading volume turned out to be the largest over the past week, just two days after recording the lowest volume day since April 2019, which was the calm before the storm.
BTC/USD BitStamp 4-Hour Chart
BTC/USD BitStamp 1-Day Chart
Source: cryptopotato.com
View original post


