Ripple Price Analysis
Ripple Price Analysis: XRP Plumets Below $0.30, New 2019 Low Coming Up?
XRP saw a very sharp decrease of around 10% over the past 24 hours, bringing its the price beneath the 2019 strong support at $0.30 to reach where it is currently trading at $0.2598. The decline is perhaps reactive to Bitcoin’s plunge today.
XRP remains the third-largest cryptocurrency with a market cap of $11.27 billion, however, it looks like things may get worse before they get better. XRP will need to make some serious gains against BTC to bring to get back above the $0.30 support level.
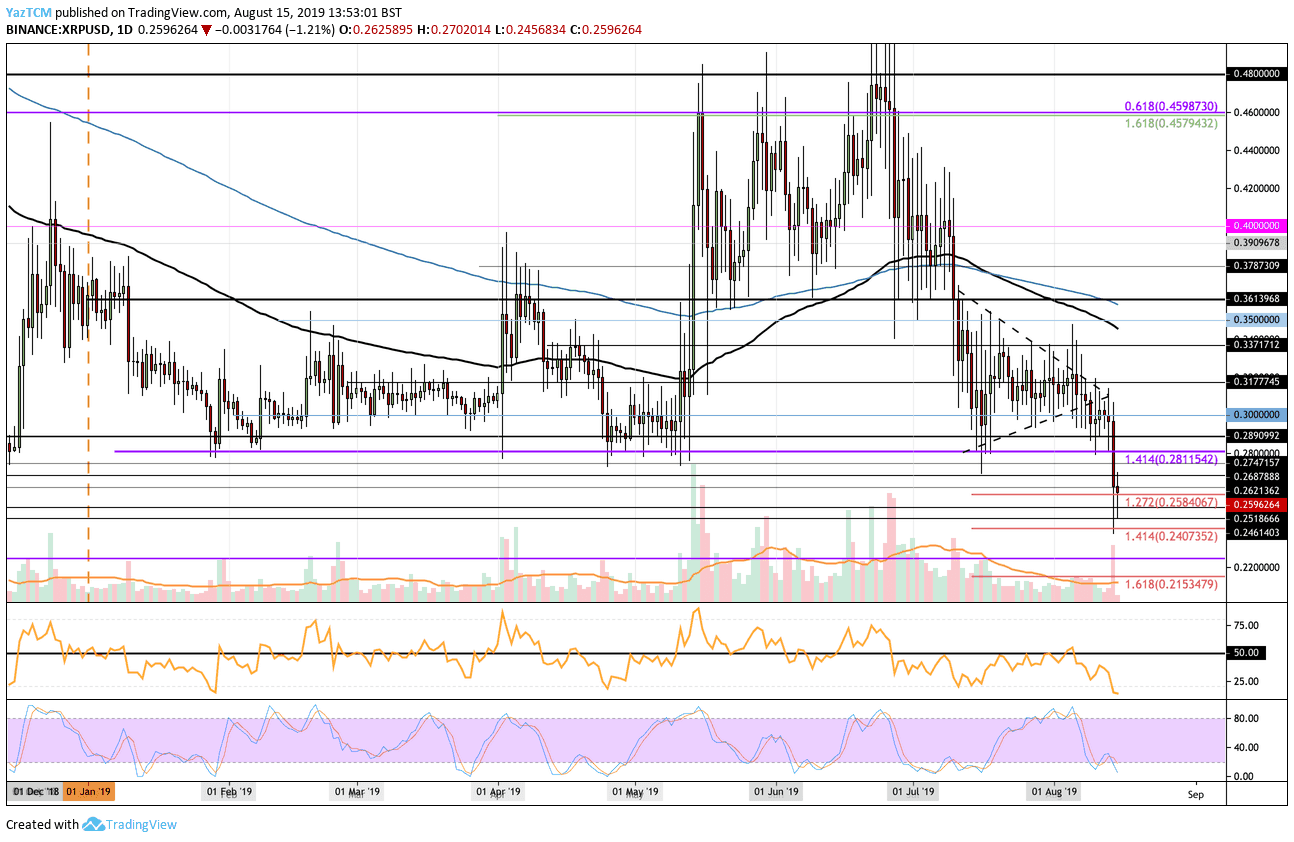
Looking at the XRP/USD 1-Day Chart:
- Since our previous XRP/USD analysis, XRP plummeted beneath the $0.30 level and continued to fall until reaching support around $0.2584. XRP went as low as $0.24 but has managed to rebound slightly from there.
- From above: The nearest level of resistance is located at $0.2687 and $0.27. Above this, higher resistance lies at $0.2747, $0.28, and $0.2811. If the bulls continue to push XRP/USD higher, further resistance is found at $0.2890 before the market is free to make an attempt at $0.30, once again.
- From below: If the sellers brak beneath the current support at $0.2584 we can expect the next levels of support to be located at $0.2518 and $0.25. Beneath $0.24, further support lies at $0.2450, $0.2407, and $0.2350.
- The trading volume has seen a sudden surge during the latest sell-off.
- The RSI has plummeted into extremely oversold conditions, a level not seen since December 2018. We do not expect the RSI to stay here for very long, which is why we expect a rebound at some time soon.
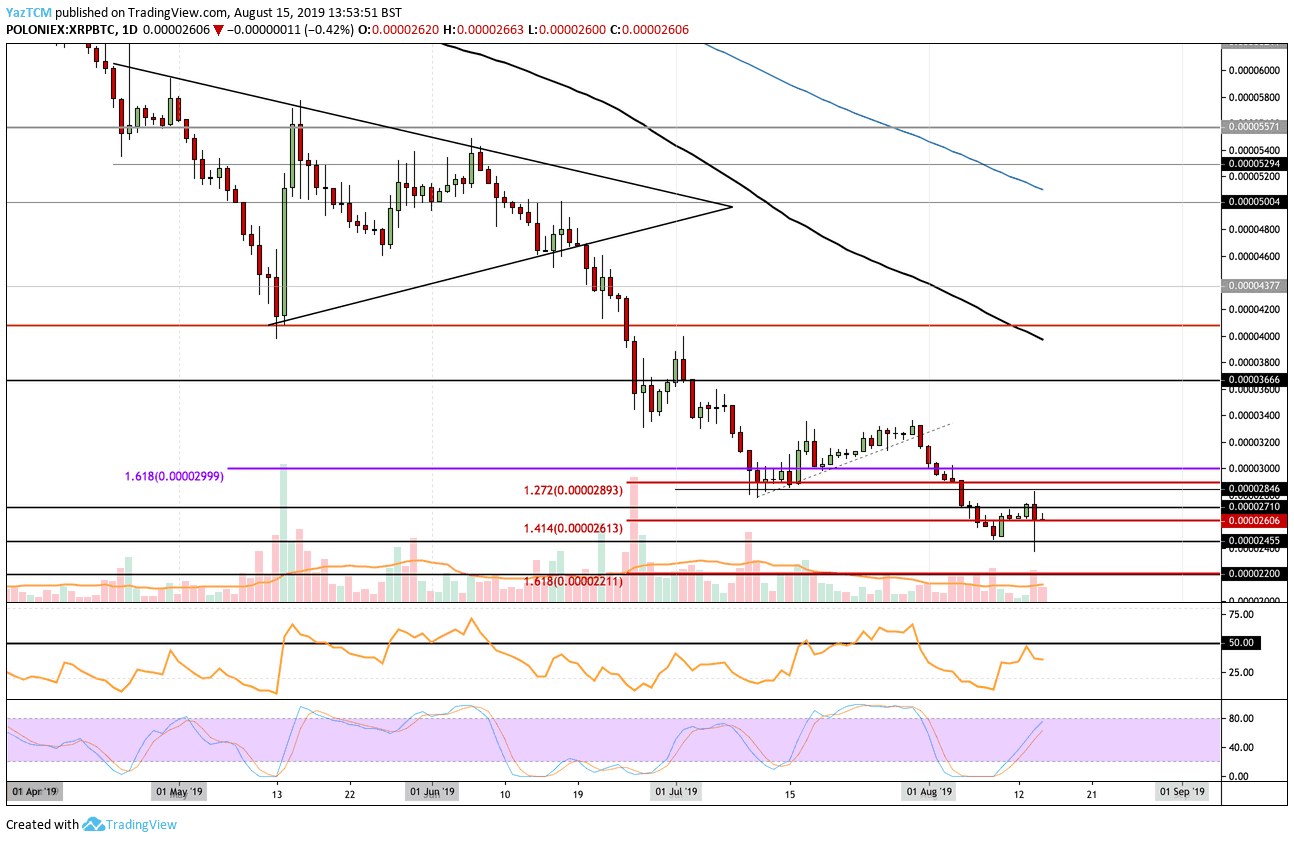
Looking at the XRP/BTC 1-Day Chart:
- Against Bitcoin, we can see that XRP is showing a very slight sign of promise after being able to rebound at the 2455 SAT level. The cryptocurrency has managed to remain above here (except for a brief spike below) as it currently battles around the 2600 SAT level.
- From above: The nearest level of resistance lies at 2710 SAT. Above this, higher resistance lies at 2893 SAT and 3000 SAT. If the bulls can break back above 3000 SAT, higher resistance lies at 3200 SAT, 3400 SAT, and 3666 SAT.
- From below: The nearest level of support now lies at 2600 SAT. If the sellers break beneath here, further support is then located at 2455 SAT and 2400 SAT. Beneath 2400 SAT, we can find the next levels of support at 2200 SAT and 2000 SAT.
- The trading volume has increased dramatically over the past couple of days.
- The RSI had made an attempt to break above 50 but has failed to do so. This shows that the sellers remain in control of the market momentum.
Be the first to know about our price analysis, crypto news and trading tips: Follow us on Telegram or subscribe to our weekly newsletter.
Source: cryptopotato.com
View original post