
Bitcoin Price History – Technical Analysis Showing Bullish Sign From 2015

Bitcoin price has consolidated the last week for the most part with some downside pressure. The last 7 days, Bitcoin price has returned -1.53% as the market shifted towards altcoins. Despite Bitcoin price falling the last week, it should be noted that technicals right now are highly bullish based on price action witnessed in April of 2019. Why could BTC Price rally & test $11,000 levels?
Bitcoin Price Sell-Off
As Visionary Financial mentioned in recent bitcoin technical analysis, $10,000 levels seemed to serve as tight resistance. Bitcoin price rallied to $10,000 levels, but quickly rejected and witnessed some profit taking. At the time, we mentioned that it appeared to be normal price action. Bitcoin still experiences high volatility and that’s why $9,400 serves as support right now. Unless bitcoin price dips below $9,400, one could argue BTC is still experiencing bullish indicators.
Bitcoin Price History – Golden Cross
Right now you may see some traders / investors talking about a “golden cross“, but what the heck is it? A golden cross is a technical measure that helps determine price sentiment. When the 50 day moving average crosses above the 200 day moving average, it’s historically been a very bullish indicator. This study has applied to both cryptocurrency and traditional markets. To make it clearer, take a look at the bitcoin chart below. You will see that the same scenario happened to Bitcoin price in April 2019. After the golden cross occurred, Bitcoin price rallied from $4,500 to nearly $13,000.
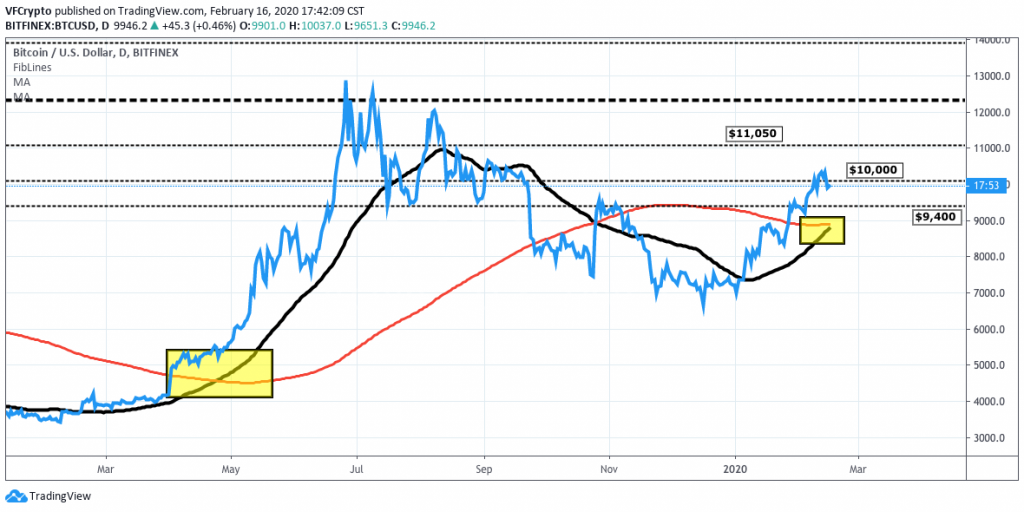
This event is extremely rare. If you apply Bitcoin on a yearly chart, you will see the only other time the golden cross occurred was November of 2015 when Bitcoin price was sitting at $250.00.
Bitcoin Price Hasn’t Confirmed Yet
It’s worth noting that the golden cross has not occurred yet on the 1 year chart. You can see that it’s very close based on the display above, but that means nothing. Scenarios like this have happened all the time where an indicator looks appealing but ultimately fails. That’s why $9,400 on the downside is being monitored as well. Even though it appears Bitcoin price will accomplish the golden cross to the upside, it’s always important to manage overall risk by looking at the downside as well. If the golden cross is rejected, you’re most likely looking at $9,400 test to the downside. On the flip side, if the golden cross is confirmed – you could see a $10,000 push all the way up to a $11,000 test.
Image Source: Pixabay
The information has been obtained from sources we believe to be reliable; however no guarantee is made or implied with respect to its accuracy, timeliness, or completeness. This material has been prepared for informational purposes only. This Article was sourced from Visionary Financial . Visionary Financial and its affiliates do not provide investment, tax, legal or accounting advice.
Source: nulltx.com
View original post


