
Bitcoin Finally Breaks $11,000: Can $15K Really Be The Target This Week? BTC Price Analysis
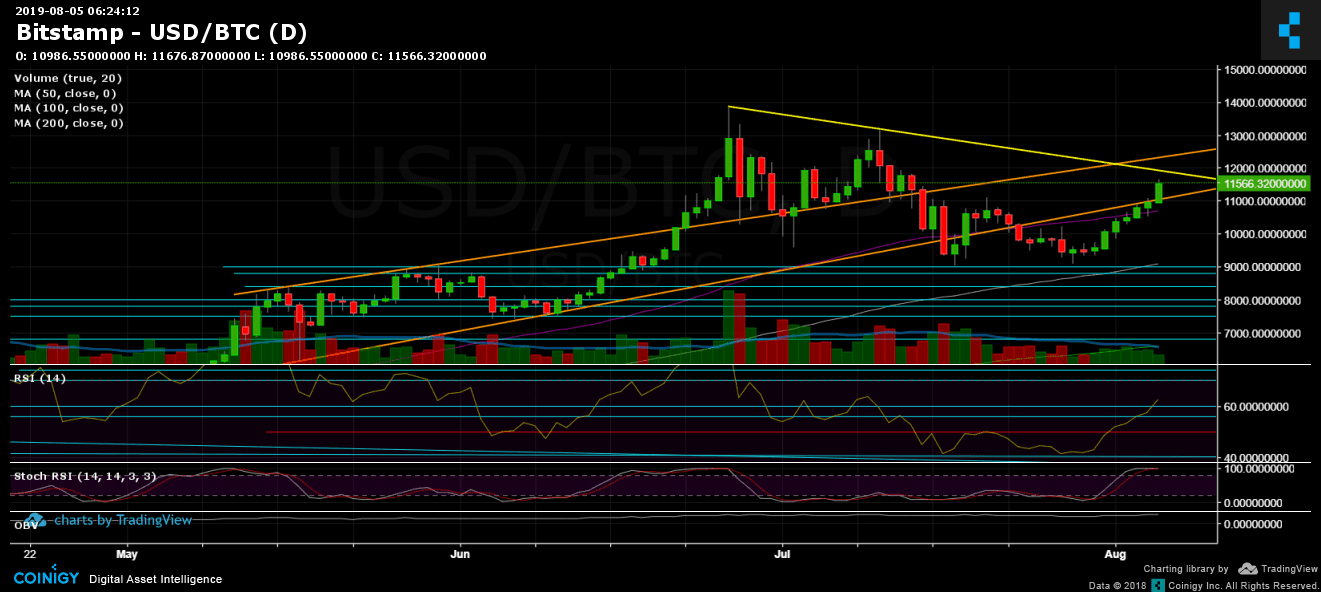
Yesterday, Bitcoin was hovering most of the day amid the $10,800 – $11,000 trying out to overcome the long term ascending trend-line, shown on our daily chart (marked in orange).
As the Asian markets woke up, it finally happened: The trend line, along with the significant $11,000 resistance area – got left behind. By breaking up $11,000, Bitcoin finally puts an end to the lower-highs formation over the past 20+ days (daily chart).
Could Bitcoin face new 2019 highs? Max Keiser said Bitcoin would reach $15,000 this week, but could it be?
I’m sensing #Bitcoin will cross $15,000 this week. Confidence in central governments, central banks, and centralized, fiat money is at a multi-decade low.
— Max Keiser, tweet poet. (@maxkeiser) August 3, 2019
In the meantime, when you think there is no further bottom, following the surging Bitcoin dominance rate over the market, the altcoins tumble even more. Ethereum is seeing its lowest level against Bitcoin since March 2017. Other altcoins bleed their Bitcoin value, in what seems like an endless tunnel. No one can predict, when, if ever, an altcoin season will take place. Until then – risk management is the name of the game.
Total Market Cap: $305 billion
Bitcoin Market Cap: $206 billion
BTC Dominance Index: 67.6%
*Data by CoinGecko
Key Levels to Watch
– Support/Resistance:
Following the massive breakout, Bitcoin is now facing the $11,500 – $11,600 resistance area. The next level of resistance would be $11,800 to $12,000. This contains the 2019-high descending trend-line marked in yellow on the daily chart. The following resistance will then be at $12,400 – $12,500, before reaching to the current 2019 high areas around $13,500 – $13,880.
From below, the nearest support area lies at the current price area. Further down is the descending trend-line resistance turned support at $11,150. Below is the $11,000, followed by the good “old” $10,500 – $10,600 (from yesterday).
– Daily chart’s RSI: The RSI showing bullish momentum, the breakout is real as the RSI breaks the 60 bullish level, facing now 64. Stochastic RSI oscillator is about to cross-over to the downside as reaching the oversold territory. If this plays out, Bitcoin will likely go through a correction before trying again for the higher levels (as we are under bullish conditions, till proved otherwise).
– Trading Volume: It was mentioned here already, but the current Bitcoin rally lacks some buyer’s volume so far. This can change at any moment, and maybe part of the reason is the world didn’t yet return to workdays from the weekend. Watch how this volume candle closes today (Monday).
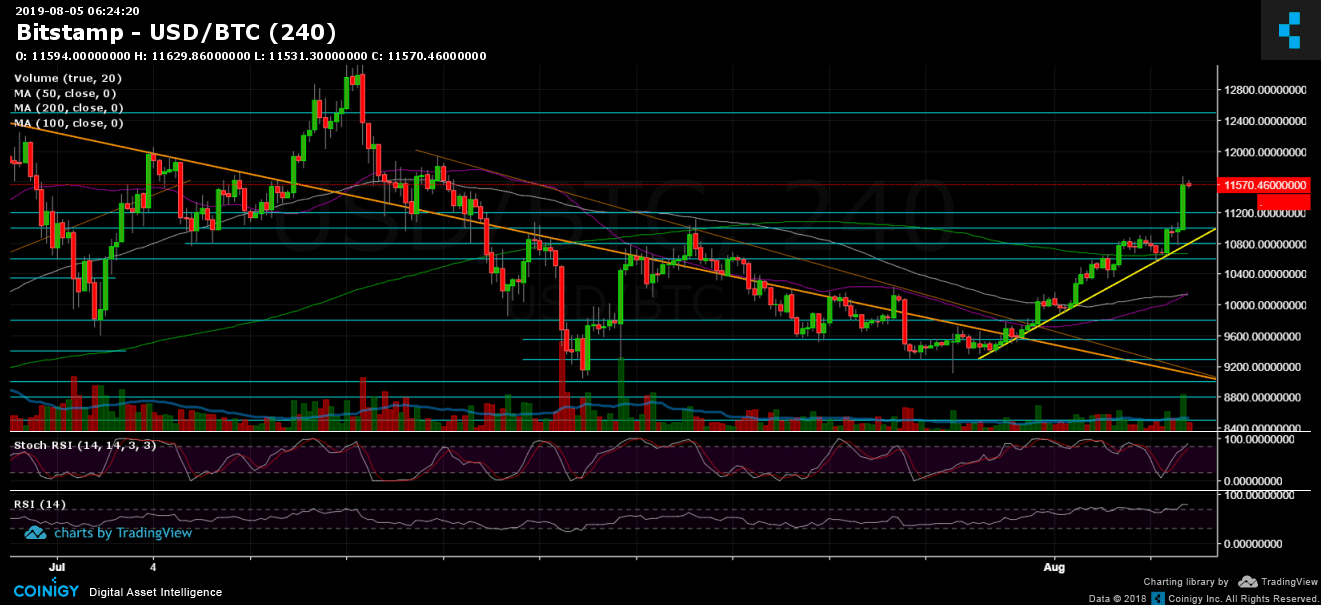
BTC/USD BitStamp 4-Hour Chart
BTC/USD BitStamp 1-Day Chart
Source: cryptopotato.com
View original post


