
Bitcoin Looks Bullish, But Could This Action Turn Into a False Breakout? BTC Price Analysis
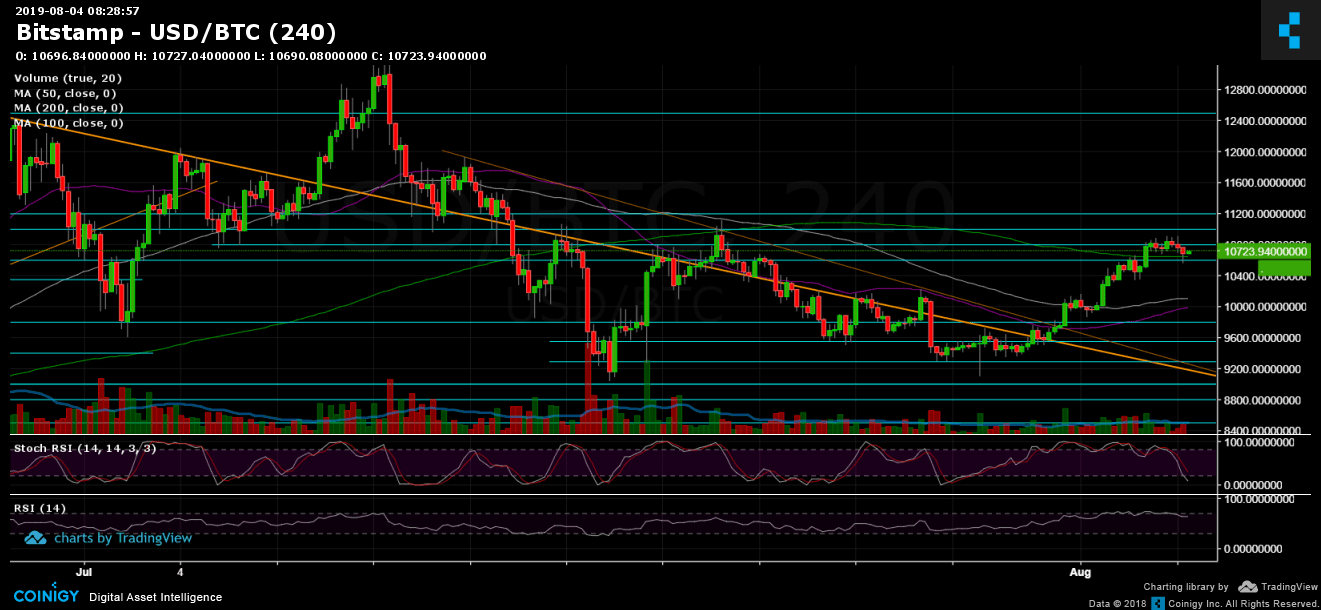
Following the colossal price rally, Bitcoin continued in its explosion above the 5-digits mark. Following a day of consolidation at the significant $10,500 – $10,600 resistance level (along with the daily MA-50), the coin broke above impressively into the next resistance zone of $10,800 – $11,000.
However, after recording a new 14-days high at $10,919 (Bitstamp rate), Bitcoin encountered the long-term ascending trend-line. That line was supporting Bitcoin since the beginning of May, and only recently Bitcoin broke down from it. Yesterday was the first attempt to get back on top of the line, testing it as resistance.
A proof of the strength of the descending line is the fact that Bitcoin touched the line, got rejected, and quickly lost around $350 of its value, back to test the $10,500 – $10,600 area as support.
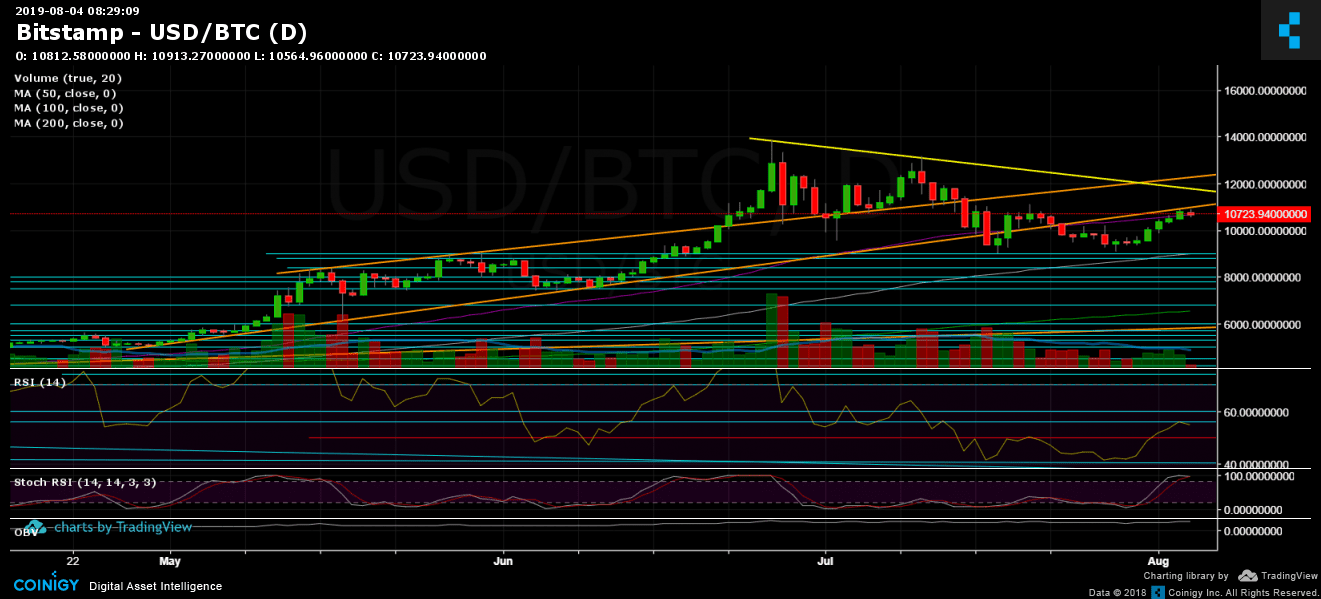
The RSI momentum indicator (shown on the following 1-day chart) finally broke up the 50 level, back to the bullish territory and turned around bearish precisely upon reaching our marked resistance at the 56 RSI level.
A word about the altcoins – well, when you don’t believe it can get more ugly, new floors are being discovered. It will be hard for the altcoins to get any momentum with such conditions of high Bitcoin volatility. As we mentioned before on our altcoins trading tip guide, the vast majority of those coins will just bleed their way to death overtime. And It doesn’t matter whether Bitcoin goes up or down.
Total Market Cap: $287 billion
Bitcoin Market Cap: $191 billion
BTC Dominance Index: 66.6%
*Data by CoinGecko
Key Levels to Watch
– Support/Resistance:
After getting rejected from the daily long-term ascending trend-line (this time as resistance, the line is drawn in bold orange), Bitcoin marked the last as the next significant resistance level, along with the $11,000 – $11,200 mark. In the case of a break-up, the following possible resistance levels are $11,500 (along with the 2019-high descending trend-line marked in yellow on the daily chart), $11,800, $12,000, $12,200 and $12,500.
From below, the nearest support area lies at $10,500 – $10,600 (resistance turned support) which also contains the significant 50-days moving average line (marked in purple on the daily chart). Further below lies the support zone at $10,000 – $10,200, which contains the 4-hour’s chart MA-50 (purple line) and MA-100 (white line). The next levels of support below $10K are $9800 and $9550.
– Daily chart’s RSI: discussed above. Stochastic RSI oscillator is about to cross-over to the downside as reaching the oversold territory. If this plays out, Bitcoin will likely go through a deeper correction before trying again for the higher levels (as we are under bullish conditions, till proved otherwise).
– Trading Volume: As mentioned in our previous price analysis, the last spike didn’t carry high trading volume levels. This is reflected in the recent rejection upon reaching the ascending trend-line (as resistance). If Bitcoin wants to conquer higher levels firmly, it must be backed by more significant amounts of buyers.
BTC/USD BitStamp 4-Hour Chart
BTC/USD BitStamp 1-Day Chart
Source: cryptopotato.com
View original post


