
Bitcoin Price Analysis: RSI at Lowest Level Since February, New Lows Ahead?
In our recent analysis, we mentioned the fragility surrounding Bitcoin’s current price action, and we added that the coin’s price tends to move sharply during weekends (low volume makes it much easier to manipulate the market).
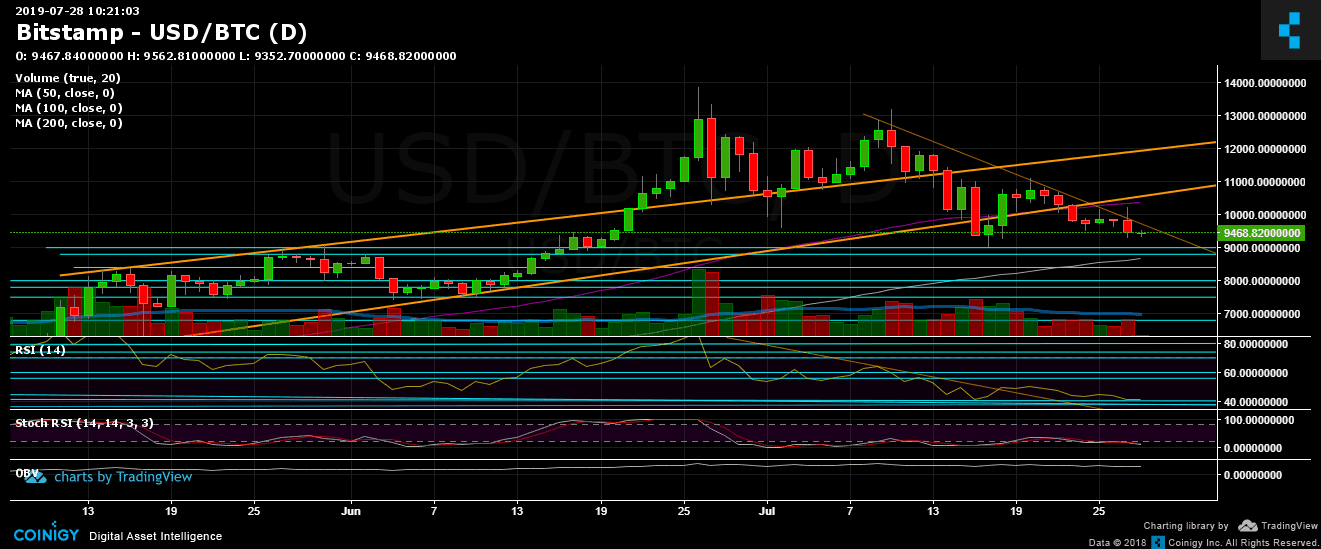
Looking on the daily chart, we can see that yesterday Bitcoin reached a daily high of nearly $10,200 (the 50-day moving average), which quickly turned into a false breakout of the mid-term descending trend line (which started forming three weeks ago). Evidence of the fake breakout can be seen on the wick of yesterday’s red candle.
That fake breakout ended up being a long squeeze before the price plunged to a daily low of $9,289. This is not a coincidence; this is the low that was reached exactly ten days ago.
Since then, Bitcoin has been trading between the aforementioned low (~$9,300) and the support-turned-resistance area around $9,550. In my opinion, there is a higher chance of Bitcoin discovering lower price levels before getting back on the bullish track (which is the longer-term sentiment).
Lowest RSI Since February
Looking at the daily chart’s RSI, which has been hovering in bearish territory for the past two weeks, the indicator is facing 40, which is its lowest level since February 6 of this year.
The low of consolidation from last month’s uptrend is approximately $9,000, which isn’t far from the current price.
From below, there is an immediate target area to watch for containing decent demand. This is the $8,500-$9,000 level: it includes the 100-day moving average line (marked in white) along with a significant long-term Fibonacci retracement level (~$,8500) and the key support levels of $8,800 and $8,500.
However, the fact that so many analysts have mentioned $8,500 as a possible target in the short term actually makes it less likely. Hence, I’ve said $8,500 to $9,000, though there is also the possibility of going lower than $8,500. Bitcoin tends to surprise.
From the other side, since reaching the $13,880 yearly high, Bitcoin has been moving tooth-style and producing lower highs and lower lows. If this continues, then there is also the chance that we will see another lower high (roughly below $10K) before getting below $9,000.
Total Market Cap: $263 billion
Bitcoin Market Cap: $169 billion
BTC Dominance Index: 64.4%
*Data from CoinGecko
Key Levels to Watch
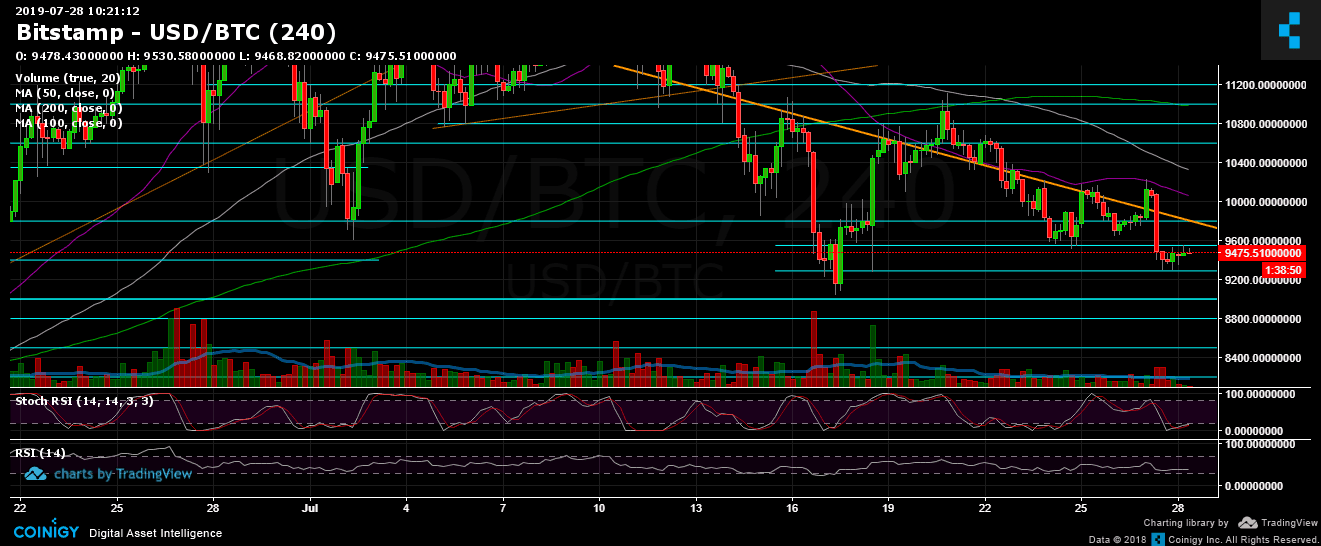
Support/Resistance: As mentioned previously, $9,550 has become a support-turned-resistance level. This, along with the mid-term descending trend line (marked in orange) is the first obstacle for Bitcoin in its effort to reverse yesterday’s plunge. Next will be the $9,800-$10,000 resistance zone, and then the 50-day moving average line currently located around $10,300.
Daily chart’s RSI: Discussed above.
Trading Volume: This past week, Bitcoin’s trading volume has seen monthly lows. Interest has also declined, with Google Trends data showing a 50% decrease in the number of searches for “Bitcoin.” Is this the calm before the storm?
BTC/USD Bitstamp 4-Hour Chart
BTC/USD Bitstamp 1-Day Chart
Source: cryptopotato.com
View original post


