Bitcoin Cash Analysis: BCH Facing Uphill Task, Can Bulls Gain Traction?
- Bitcoin cash price failed to settle above the $330 resistance and declined against the US Dollar.
- The price is now trading with a bearish below the $310 support area.
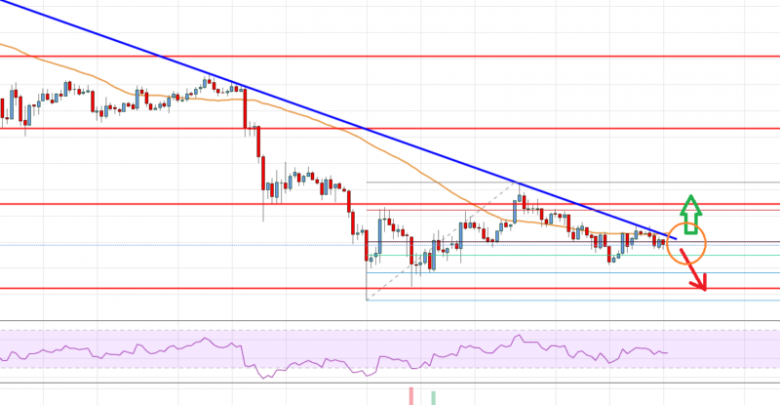
- There is a significant bearish trend line forming with resistance near $308 on the 4-hours chart of the BCH/USD pair (data feed from Kraken).
- The pair could start a strong upward move if it breaks the $310 and $330 resistance levels.
Bitcoin cash price is facing a significant resistance near the $310.00 area against the US Dollar. BCH price could either climb above $310 or it might extend losses below the $275 support.
Bitcoin Cash Price Analysis
Recently, bitcoin cash price recovered from the $255 swing low against the US Dollar. The BCH/USD pair broke the $300 resistance level to start the recovery. Moreover, it broke the $320 resistance and the 55 simple moving average (4-hours). However, the bulls struggled to remain in action above the $330 resistance. A swing high was formed near $345 and the price started a fresh decline.
It traded below the $330 and $320 levels to move into a bearish zone. Moreover, there was a break below the 50% Fib retracement level of the last recovery from the $255 low to $345 high. The price settled below the $310 level and the 55 simple moving average (4-hours). Recently, it spiked below the 61.8% Fib retracement level of the last recovery from the $255 low to $345 high.
More importantly, there is a significant bearish trend line forming with resistance near $308 on the 4-hours chart of the BCH/USD pair. If the pair breaks the trend line and surpassed the $310 level, it could correct higher. The main resistance is near the $330 level. Therefore, an upside break above the $330 level may perhaps start a strong rise in the coming sessions.
Conversely, if there is no upside break above $310 or $330, the price could continue to decline. An immediate support is at $275. It represents the 76.4% Fib retracement level of the last recovery from the $255 low to $345 high. Below the $275 support, the price will most likely retest the $255 swing low.

Looking at the chart, bitcoin cash price is clearly facing strong resistances near the $310 and $330 levels. If the bulls continue to struggle, there is a risk of more downsides below $275 and $255 in the near term.
Technical indicators
4 hours MACD – The MACD for BCH/USD is currently gaining momentum in the bearish zone.
4 hours RSI (Relative Strength Index) – The RSI for BCH/USD is currently below 50, with a bearish angle.
Key Support Levels – $275 and $255.
Key Resistance Levels – $310 and $330.
Source: livebitcoinnews.com
View original post


