- Litecoin started a strong increase above $65 against the US Dollar.
- LTC price is now trading above $65 and the 55 simple moving average (4-hours).
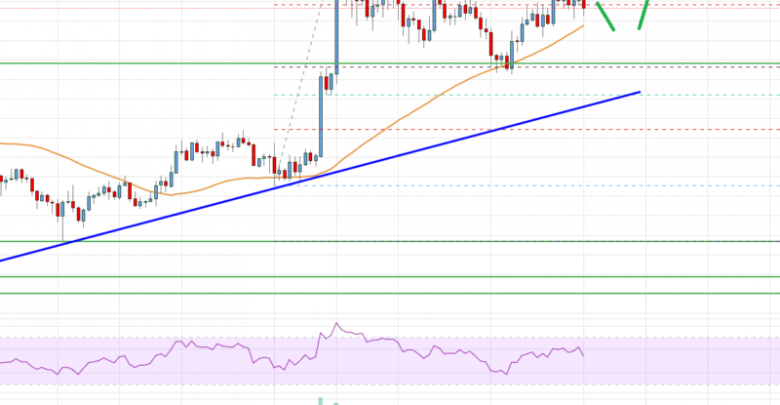
- There is a major bullish trend line forming with support near $68.50 on the 4-hours chart of the LTC/USD pair (data feed from Coinbase).
- The pair remains supported for more gains above the $85 resistance zone.
Litecoin price is rising steadily above $70 against the US Dollar, similar to bitcoin. LTC price could continue to move up if it remains well bid above the $68 level.
Litecoin Price Analysis
In the past few sessions, there was a decent increase in bitcoin, ethereum, ripple, and litecoin against the US Dollar. Earlier, LTC formed a base above the $62 level and started a fresh increase.
There was a clear move above the $68 and $70 resistance levels. The price even climbed above the $80 level and the 55 simple moving average (4-hours). However, the bears were active near the $84 zone. A high was formed near $83.42 and the price started a downside correction.
There was a move below the $80 level. The price declined below the 23.6% Fib retracement level of the key increase from the $59.10 swing low to $83.42 high.
However, the price remained well bid above $65 and the 55 simple moving average (4-hours). The 50% Fib retracement level of the key increase from the $59.10 swing low to $83.42 high also acted as a support. There is also a major bullish trend line forming with support near $68.50 on the 4-hours chart of the LTC/USD pair.
If there is a downside break below the $68.50 support, the price could accelerate lower towards the $65 level in the near term.
On the upside, the price is facing resistance near the $80 and $84 levels. A clear move above the $84 level could pump the price towards the $90 level. The next major resistance sits near the $100 level.

Litecoin (LTC) Price
Looking at the chart, litecoin price is clearly trading above $68 and the 55 simple moving average (4-hours). Overall, the price remains supported for more gains above the $85 resistance zone.
Technical indicators
4 hours MACD – The MACD for LTC/USD is now gaining pace in the bullish zone.
4 hours RSI (Relative Strength Index) – The RSI for LTC/USD is now above the 50 level.
Key Support Levels – $75 and $68
Key Resistance Levels – $82 and $84.
Source: livebitcoinnews.com
View original post


