- Ripple price started a fresh decline from the $0.3700 zone against the US dollar.
- The price is now trading above $0.30 and the 55 simple moving average (4-hours).
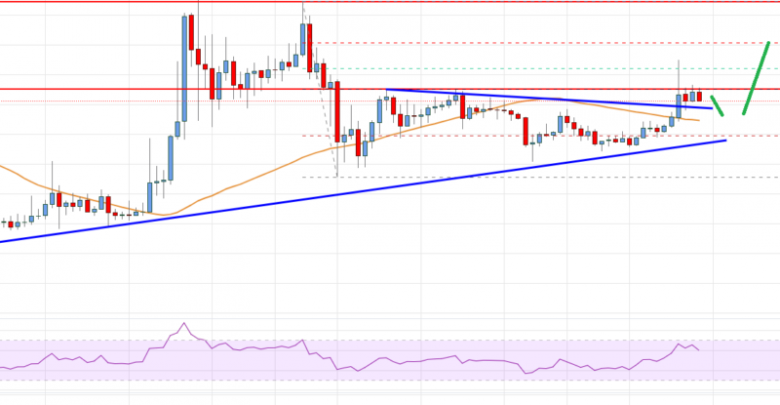
- There was a break above a major bearish trend line with resistance near $0.3000 on the 4-hours chart of the XRP/USD pair (data source from Bittrex).
- The pair could start a decent increase if there is a clear move above the $0.3200 resistance.
Ripple price is struggling below $0.4000 against the US Dollar, similar to bitcoin. XRP price must clear $0.3200 to start a fresh recovery wave in the near term.
Ripple Price Analysis
After struggling to clear $0.4000, ripple price started a fresh decline against the US Dollar. The XRP/USD pair traded below the $0.3500 support level to enter a bearish zone.
The price even broke the $0.3200 support and the 55 simple moving average (4-hours). It even spiked below the $0.3000 level and traded as low as $0.2541. Recently, there was an upside correction above the $0.2800 resistance level.
There was a break above a major bearish trend line with resistance near $0.3000 on the 4-hours chart of the XRP/USD pair. The pair is now trading above $0.40 and the 55 simple moving average (4-hours).
There was also a spike above the 50% Fib retracement level of the key decline from the $0.3692 swing high to $0.2514 low. On the upside, the price is facing resistance near $0.3200.
It is near the 61.8% Fib retracement level of the key decline from the $0.3692 swing high to $0.2514 low. The next major resistance sits near the $0.3500 zone. A clear move above the $0.3200 and $0.3500 resistance zones might start a decent recovery.
In the stated case, the price could rise towards the $0.4000 level. An initial support on the downside is near the $0.3000 level. The next main support is near the $0.2720 zone. Any more losses could lead the price towards the $0.2500 level, below which the price might even test $0.2250.

Ripple Price
Looking at the chart, ripple price is now trading above $0.3000 and the 55 simple moving average (4-hours). Overall, the price could start a decent recovery wave if it clears $0.3200 and $0.3500.
Technical indicators
4 hours MACD – The MACD for XRP/USD is now losing momentum in the bullish zone.
4 hours RSI (Relative Strength Index) – The RSI for XRP/USD is above the 50 level.
Key Support Levels – $0.3000, $0.2720 and $0.2500.
Key Resistance Levels – $0.3200 and $0.3500.
Source: livebitcoinnews.com
View original post


