- Litecoin started a fresh decline from the $85 resistance against the US Dollar.
- LTC price is now trading below $75 and the 55 simple moving average (4-hours).
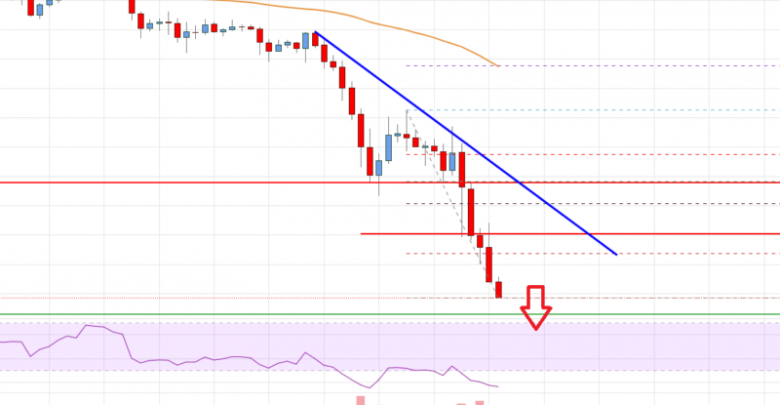
- There is a key bearish trend line forming with resistance near $66 on the 4-hours chart of the LTC/USD pair (data feed from Coinbase).
- The pair could accelerate lower towards the $52 and $50 support levels in the near term.
Litecoin price is gaining pace below $70 against the US Dollar, similar to bitcoin. LTC price could continue to move down towards the $50 support.
Litecoin Price Analysis
This week, there was a major decline in bitcoin, ethereum, ripple, and litecoin against the US Dollar. Earlier, LTC attempted an upside break above the $85 resistance.
The price struggled to gain pace above $85 and started a fresh decline. There was a sharp move below the $80 and $75 support levels. The bears were able to push the price below the $70 support and the 55 simple moving average (4-hours).
It even traded below $60 and is showing a lot of bearish signs. On the downside, an immediate support is near the $58 level. The next key support is near the $55 level. If there is a downside break below the $55 support, the price could continue to move down towards the $50 level in the near term.
On the upside, the price might face resistance near the $65 and $66 levels. It is near the 23.6% Fib retracement level of the recent decline from the $85 swing high to $59 low.
The first major resistance is near the $67 level. There is also a key bearish trend line forming with resistance near $66 on the 4-hours chart of the LTC/USD pair. The next key resistance is near the $72 level or the 50% Fib retracement level of the recent decline from the $85 swing high to $59 low. To start a fresh increase, the price must clear $72 and $75.

Litecoin (LTC) Price
Looking at the chart, litecoin price is clearly trading below $70 and the 55 simple moving average (4-hours). Overall, the price could accelerate lower towards the $52 and $50 support levels in the near term.
Technical indicators
4 hours MACD – The MACD for LTC/USD is now gaining pace in the bearish zone.
4 hours RSI (Relative Strength Index) – The RSI for LTC/USD is now below the 50 level.
Key Support Levels – $55 and $50
Key Resistance Levels – $65 and $72.
Source: livebitcoinnews.com
View original post


