- Ripple price started a fresh decline from the $0.7800 zone against the US dollar.
- The price is now trading below $0.70 and the 55 simple moving average (4-hours).
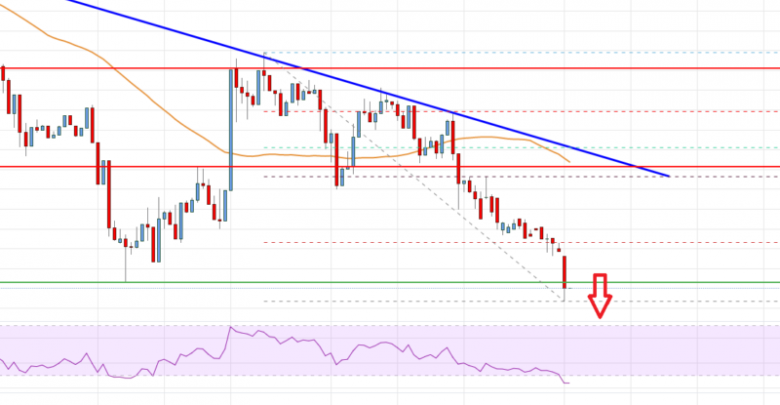
- There is a crucial bearish trend line forming with resistance near $0.7400 on the 4-hours chart of the XRP/USD pair (data source from Bittrex).
- The pair could extend decline if there is a move below the $0.6800 support zone.
Ripple price is struggling below $0.7000 against the US Dollar, similar to bitcoin. XRP price must clear $0.7400 to start a fresh increase in the near term.
Ripple Price Analysis
After struggling to clear $0.7800, ripple price started a fresh decline against the US Dollar. The XRP/USD pair traded below the $0.7200 support level to enter a bearish zone.
The price even broke the $0.7000 support and the 55 simple moving average (4-hours). It even spiked below the $0.6800 level and traded as low as $0.6735. It is now showing a lot of bearish signs below $0.7000. On the upside, the price is facing resistance near the $0.7020 zone.
The 23.6% Fib retracement level of the recent decline from the $0.7990 swing high to $0.6735 low is near the $0.7030 to act as a resistance. The next major resistance is near the $0.7400 level.
There is also a crucial bearish trend line forming with resistance near $0.7400 on the 4-hours chart of the XRP/USD pair. The trend line is near the 50% Fib retracement level of the recent decline from the $0.7990 swing high to $0.6735 low.
A clear move above the $0.7400 level might send the price towards the $0.7800 level. Any more gains could lead the price towards the $0.8000 level.
An initial support on the downside is near the $0.6800 level. The next main support is near the $0.6500 zone. Any more losses could lead the price towards the $0.6200 level in the near term, below which the price might even test $0.6000.

Ripple Price
Looking at the chart, ripple price is now trading below $0.7000 and the 55 simple moving average (4-hours). Overall, the price could extend decline if there is a move below the $0.6800 support zone.
Technical indicators
4 hours MACD – The MACD for XRP/USD is now gaining momentum in the bearish zone.
4 hours RSI (Relative Strength Index) – The RSI for XRP/USD is below the 30 level.
Key Support Levels – $0.6800, $0.6500 and $0.6000.
Key Resistance Levels – $0.7020 and $0.7400.
Source: livebitcoinnews.com
View original post


