- Ethereum price started a fresh decline from the $3,300 zone against the US Dollar.
- ETH price is now trading below $3,200 and the 55 simple moving average (4-hours).
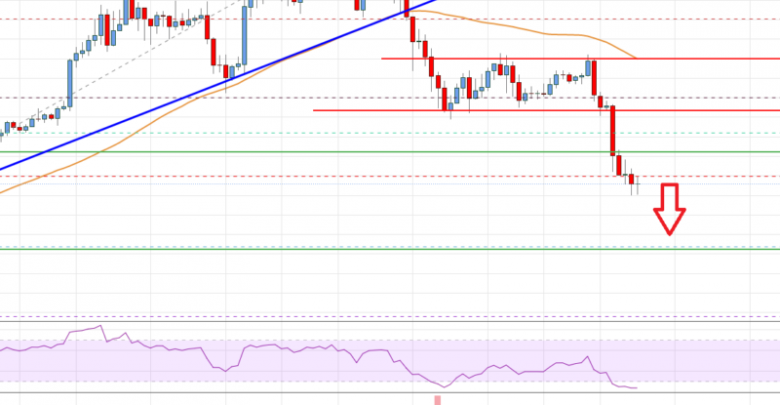
- There was a break below a major bullish trend line with support near $3,400 on the 4-hours chart (data feed from Coinbase).
- The pair could continue to move down towards the $2,820 support zone in the near term.
Ethereum price is gaining pace below $3,000 against the US Dollar. ETH/USD remains at a risk of more downsides towards the $2,820 support zone.
Ethereum Price Analysis
Recently, ethereum struggled to stay above the $3,350 support zone against the US Dollar. ETH price started a fresh decline below the $3,300 level and moved into a bearish zone.
There was a break below a major bullish trend line with support near $3,400 on the 4-hours chart. The pair declined below the 50% Fib retracement level of the upward move from the $2,819 swing low to $3,581 high. The bears gained strength for a move below the $3,250 support zone.
The price is now trading below $3,200 and the 55 simple moving average (4-hours). It is also trading below the 76.4% Fib retracement level of the upward move from the $2,819 swing low to $3,581 high. On the downside, an initial support is near the $2,900 level.
The next major support is now near the $2,820 level. A break below the $2,820 support could push the price to $2,650. Any more losses could lead the price towards $2,550 or even $2,500.
On the upside, the price is facing resistance near the $3,060 level. The first major resistance is now forming near the $3,165 level.
A clear move above the $3,165 level might start a steady increase. The next key resistance is near the $3,300 zone, above which the price might accelerate higher towards the $3,500 level.

Ethereum Price
Looking at the chart, Ethereum price is clearly trading below the $3,200 zone and the 55 simple moving average (4-hours). Overall, ether price could continue to move down towards the $2,820 support zone in the near term.
Technical indicators
4 hours MACD – The MACD for ETH/USD is now gaining momentum in the bearish zone.
4 hours RSI (Relative Strength Index) – The RSI for ETH/USD is now below the 50 level.
Key Support Levels – $2,900, followed by the $2,820 zone.
Key Resistance$ Levels – $3,060 and $3,165.
Source: livebitcoinnews.com
View original post


