- Litecoin price surged recently and tested the $59-60 resistance area against the US Dollar.
- LTC price is placed nicely in an uptrend and it could continue to move higher towards $60.00 and $65.00.
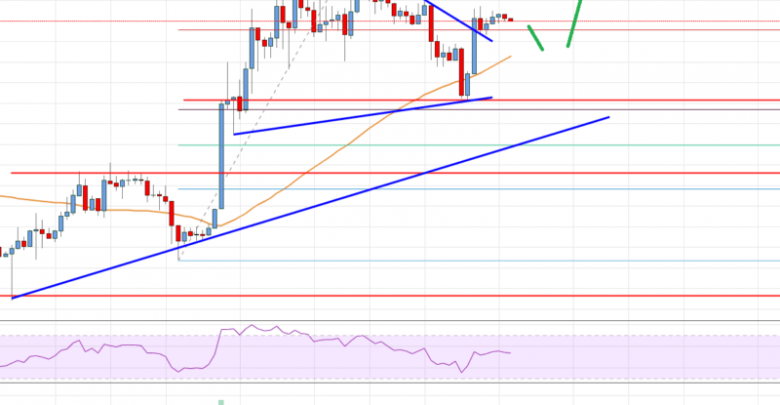
- There is a crucial bullish trend line formed with support at $51.00 on the 4-hours chart of the LTC/USD pair (data feed from Coinbase).
- The pair remains supported on dips and it could attempt to climb above the $59.04 high in the near term.
Litecoin price gained bullish momentum recently against the US Dollar and bitcoin. LTC is trading above the $55.00 resistance and eyeing an upside break above the $60.00 resistance.
Litecoin Price Analysis
In the last analysis, we discussed a solid upward move in litecoin price towards $58.00 and $60.00 against the US Dollar. The LTC/USD pair did move higher and outperformed other major cryptocurrencies such as bitcoin, ripple, Ethereum, and bitcoin cash. It broke the $54.00 and $55.00 resistance levels. The upward move was strong, with a break above $58.00 and close above the 55 simple moving average (4-hours). The price traded close to the $60.00 resistance and a new monthly high was formed at $59.04.
Later, the price corrected lower and declined below the $58.00 and $55.00 support levels. Besides, the price declined below the 23.6% Fib retracement level of the last wave from the $44.36 low to $59.04 high. However, the decline found support near the $52.15 level and the 55 simple moving average (4-hours). Moreover, the 50% Fib retracement level of the last wave from the $44.36 low to $59.04 high acted as a support. The price climbed higher once again and traded above the $54.00 and $55.00 levels.
The current price action is positive and suggests more gains towards the $58.00 and $60.00 resistance levels. If there are more gains, the price could test the $62.00 level. On the downside, there is a decent support formed near the $54.00 level. Moreover, there is a crucial bullish trend line formed with support at $51.00 on the 4-hours chart of the LTC/USD pair.

Looking at the chart, litecoin price is placed nicely in a positive zone above the $54.00 and $50.00 levels. If there is a downside correction, buyers are likely to defend losses below $50.00. On the upside, the ultimate aim could be a proper push above the $60.00 and $62.00 resistance levels.
Technical indicators
4 hours MACD – The MACD for LTC/USD is placed heavily in the bullish zone, with a positive bias.
4 hours RSI (Relative Strength Index) – The RSI for LTC/USD moved higher and settled nicely above the 50 level.
Key Support Levels – $54.00 and $51.00.
Key Resistance Levels – $58.00 and $60.00.
Source: livebitcoinnews.com
View original post