- Ethereum price started a fresh decline from well above $2,700 against the US Dollar.
- ETH price is now trading below $2,600 and the 55 simple moving average (4-hours).
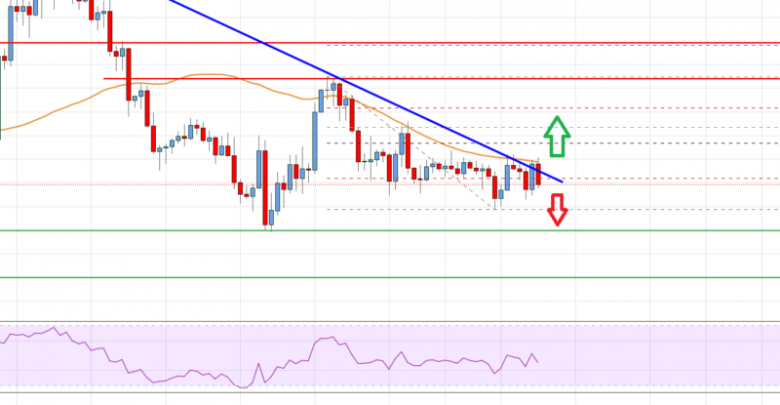
- There is a major bearish trend line forming with resistance near $2,565 on the 4-hours chart (data feed from Coinbase).
- The pair could continue to move down if it fails to clear the $2,600 resistance zone.
Ethereum price is struggling below $2,600 against the US Dollar. ETH/USD remains at a risk of more downsides below the $2,500 level.
Ethereum Price Analysis
Recently, ethereum saw a fresh bearish move from well above the $2,700 level against the US Dollar. ETH price traded below the $2,650 support zone and the 55 simple moving average (4-hours).
The bears gained strength for a move below the $2,600 level. The price even declined below the $2,500 support and traded as low as $2,492. It is now consolidating losses and trading above the $2,500 level. There was a move above the 23.6% Fib retracement level of the recent decline from the $2,774 swing high to $2,492 swing low.
On the upside, the price is facing resistance near the $2,565 level. There is also a major bearish trend line forming with resistance near $2,565 on the 4-hours chart.
The first major resistance is now forming near the $2,600 level and the 55 simple moving average (4-hours). The next key resistance is near the 50% Fib retracement level of the recent decline from the $2,774 swing high to $2,492 swing low.
A close above the $2,640 level could start another increase. The next major stop for the bulls could be near the $2,750 level. If not, there is a risk of more losses below the $2,500 level. The next major support is now near the $2,450 level.
A break below the $2,450 support could push the price to $2,325. Any more losses could lead the price towards $2,250 or even $2,100.

Ethereum Price
Looking at the chart, Ethereum price is clearly trading below the $2,600 zone and the 55 simple moving average (4-hours). Overall, ether price could continue to move down if it fails to clear the $2,600 resistance zone.
Technical indicators
4 hours MACD – The MACD for ETH/USD is now losing momentum in the bearish zone.
4 hours RSI (Relative Strength Index) – The RSI for ETH/USD is now near the 50 level.
Key Support Levels – $2,500, followed by the $2,450 zone.
Key Resistance$ Levels – $2,600 and $2,640.
Source: livebitcoinnews.com
View original post


