- Bitcoin price started a fresh increase above the $60,000 resistance against the US Dollar.
- The price is now trading above $62,000 and the 55 simple moving average (4-hours).
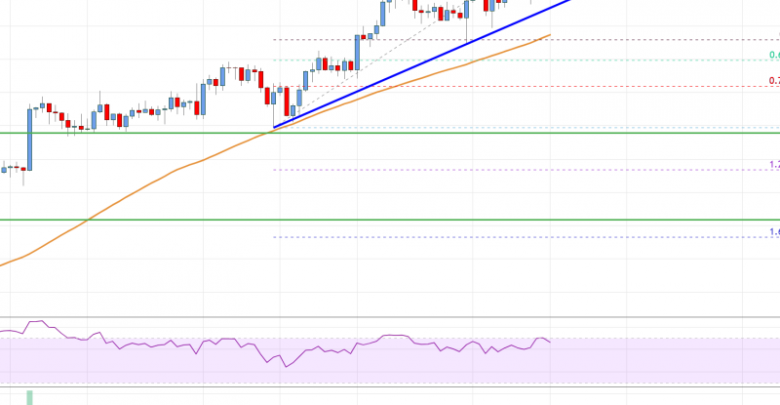
- There is a key bullish trend line forming with support near $62,000 on the 4-hours chart of the BTC/USD pair (data feed from Coinbase).
- The pair is showing positive signs and it could continue to rise above the $65,000 level.
Bitcoin price is gaining pace above $60,000 against the US Dollar. BTC remains supported on the downside near the $62,000 and $60,000 levels.
Bitcoin Price Analysis
Bitcoin price formed a base above the $55,000 level. As a result, BTC started a fresh increase above the $58,000 and $60,000 resistance levels.
The price gained pace for a move above the $62,000 level and the 55 simple moving average (4-hours). There was also a close above the $62,000 level and the 55 simple moving average (4-hours). The price traded as high as $64,500, and it is now consolidating gains.
There was a break below the $64,000 level. Bitcoin could soon test the 23.6% Fib retracement level of the upward move from the $53,873 swing low to $64,500 high.
An immediate support on the downside is near the $63,000 level. There is also a key bullish trend line forming with support near $62,200 on the 4-hours chart of the BTC/USD pair. The next key support is near the $60,000 level. The 55 SMA is also positioned near the $59,200 level to act as a strong support.
It is near the 50% Fib retracement level of the upward move from the $53,873 swing low to $64,500 high. If the price fails to stay above $59,200, it could revisit the $55,000 support zone.
On the upside, an initial resistance is near the $54,250 level. The main resistance is forming near the $65,000 zone. A close above the $65,000 zone is needed for a fresh increase. In the stated case, the price is likely to rise steadily towards the $70,000 level.

Bitcoin Price
Looking at the chart, bitcoin price is clearly trading above $62,000 and the 55 simple moving average (4-hours). Overall, the price is showing positive signs and it could continue to rise above the $65,000 level.
Technical indicators
4 hours MACD – The MACD is now gaining momentum in the bullish zone.
4 hours RSI (Relative Strength Index) – The RSI is well above the 50 level.
Key Support Levels – $62,000 and $60,000.
Key Resistance Levels – $64,500, $65,000 and $68,000.
Source: livebitcoinnews.com
View original post


