- Litecoin price found support near $140 and corrected higher against the US Dollar.
- LTC price is now trading above $162 and the 55 simple moving average (4-hours).
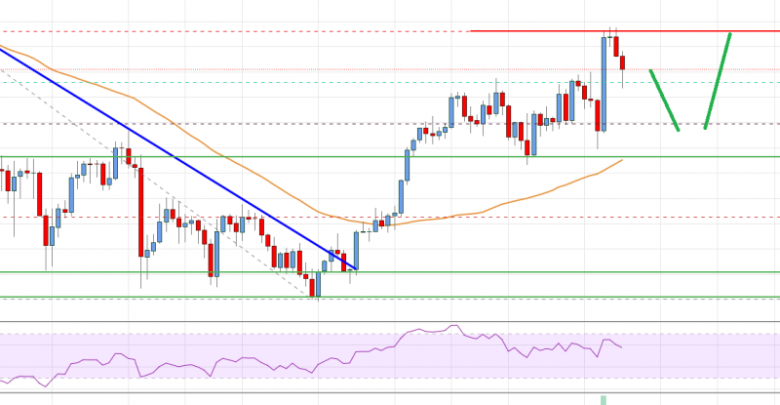
- There was a break above a major bearish trend line with resistance near $148 on the 4-hours chart of the LTC/USD pair (data feed from Coinbase).
- The pair could continue to rise towards $200 as long as it is above the $162 level.
Litecoin price is recovering higher above $160 against the US Dollar, similar to bitcoin. LTC price could continue higher if it clears $185 and $188.
Litecoin Price Analysis
This week, there was a steady increase in bitcoin, ethereum, ripple, and litecoin against the US Dollar. Earlier, LTC formed a support base above $140 and started a fresh increase.
There was a break above the $145 resistance zone. There was also a break above a major bearish trend line with resistance near $148 on the 4-hours chart of the LTC/USD pair. The pair climbed above the $155 level and the 55 simple moving average (4-hours).
Besides, there was a break above the 50% Fib retracement level of the key decline from the $196 swing high to $140 low. It is now trading above $162 and the 55 simple moving average (4-hours).
An immediate resistance is near the $182 level. It is close to the 76.4% Fib retracement level of the key decline from the $196 swing high to $140 low. The next key resistance could be $188. A close above the $185 and $188 levels could open the doors for a decent increase.
In the stated case, the price could rise towards the $200 resistance in the near term. On the downside, an immediate support is near the $170 level. If there is a downside break the $170 support level, the price could revisit $162. The next key support is near the $155 level.

Litecoin (LTC) Price
Looking at the chart, litecoin price is clearly trading above $162 and the 55 simple moving average (4-hours). Overall, the price could continue to rise towards $200 as long as it is above the $162 level.
Technical indicators
4 hours MACD – The MACD for LTC/USD is now gaining pace in the bullish zone.
4 hours RSI (Relative Strength Index) – The RSI for LTC/USD is well above the 50 level.
Key Support Levels – $170 and $162
Key Resistance Levels – $185 and $188.
Source: livebitcoinnews.com
View original post


