- Litecoin price declined heavily below $165 and tested $155 against the US Dollar.
- LTC price is now trading below $160 and the 55 simple moving average (4-hours).
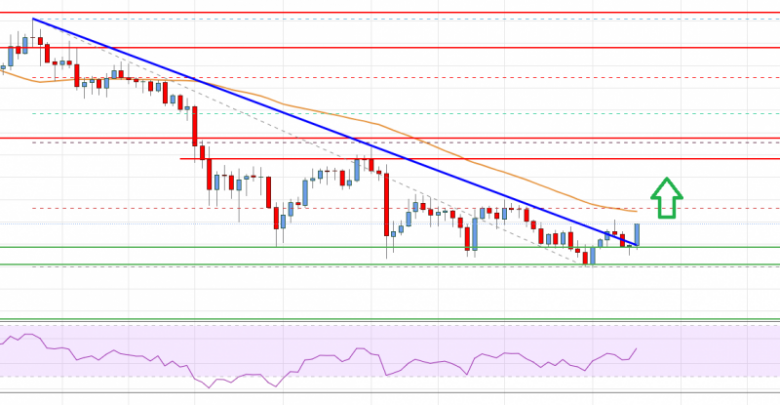
- There was a break above a key bearish trend line with resistance near $148 on the 4-hours chart of the LTC/USD pair (data feed from Coinbase).
- The pair must move above the $155 resistance to start a decent recovery in the near term.
Litecoin price is recovering losses from $140 against the US Dollar, similar to bitcoin. LTC price could continue higher if it clears $155 and $160.
Litecoin Price Analysis
This week, there was a major decline in bitcoin, ethereum, ripple, and litecoin against the US Dollar. LTC broke many supports near $160 to enter a bearish zone.
There was also a break below the $155 level and the 55 simple moving average (4-hours). It tested the $140 zone and it is now attempting an upside correction. The price is back above the $145 level. There was a break above a key bearish trend line with resistance near $148 on the 4-hours chart of the LTC/USD pair.
An immediate resistance is near the $152 level and the 55 simple moving average (4-hours). It is close to the 23.6% Fib retracement level of the main decline from the $195 swing high to $140 low.
The next key resistance could be $165. It is close to the 50% Fib retracement level of the main decline from the $195 swing high to $140 low. The main resistance could be near the $170 level. A close above the $165 and $170 levels could open the doors for a decent increase.
In the stated case, the price could rise towards the $195 resistance in the near term. On the downside, an immediate support is near the $145 level. If there is a downside break the $145 support level, the price could revisit $140. The next key support is near the $125 level.

Litecoin (LTC) Price
Looking at the chart, litecoin price is clearly trading below $160 and the 55 simple moving average (4-hours). Overall, the price must move above the $155 resistance to start a decent recovery in the near term.
Technical indicators
4 hours MACD – The MACD for LTC/USD is now gaining pace in the bullish zone.
4 hours RSI (Relative Strength Index) – The RSI for LTC/USD is just above the 50 level.
Key Support Levels – $145 and $140
Key Resistance Levels – $155 and $165.
Source: livebitcoinnews.com
View original post


