- Ethereum price started a major decline below the $3,500 support against the US Dollar.
- ETH price is now trading below $3,200 and the 55 simple moving average (4-hours).
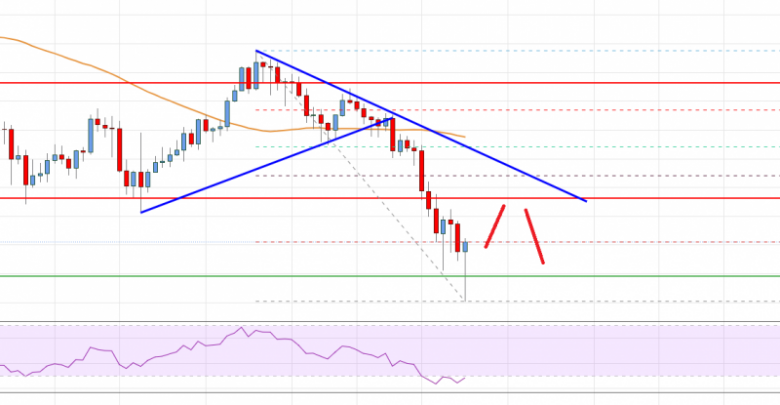
- There is a major bearish trend line forming with resistance near $3,200 on the 4-hours chart (data feed from Coinbase).
- The pair could correct higher, but the bears are likely to remain active near $3,200.
Ethereum price is showing bearish signs below $3,200 against the US Dollar. ETH/USD could resume its decline as long as it is below $3,200.
Ethereum Price Analysis
In the past few days, ethereum saw a major decline below the $3,600 zone against the US Dollar. ETH price broke the $3,400 support zone and the 55 simple moving average (4-hours).
The price even traded below the $3,200 and $3,150 levels. Finally, the price spiked below the $3,000 support level. The recent low was formed near $2,805 before the price started an upside correction. It broke the $3,000 resistance level.
It is now testing the 23.6% Fib retracement level of the recent decline from the $3,675 swing high to $2,805 low. However, the price is now trading below $3,200 and the 55 simple moving average (4-hours).
An immediate resistance is near the $3,150 level. The main resistance is now forming near the $3,200 level. There is also a major bearish trend line forming with resistance near $3,200 on the 4-hours chart. The trend line is close to the 50% Fib retracement level of the recent decline from the $3,675 swing high to $2,805 low.
The next major resistance is near the $3,400 zone and the 55 simple moving average (4-hours). A close above the $3,400 level could open the doors for a fresh increase.
An immediate support is near the $2,900 level. The main support is now near the $2,800 level. If there is a downside break below the $2,800 support, the price could test $2,650. Any more losses could lead the price towards $2,500.

Ethereum Price
Looking at the chart, Ethereum price is clearly trading well below the $3,200 zone and the 55 simple moving average (4-hours). Overall, ether price could correct higher, but the bears are likely to remain active near $3,200.
Technical indicators
4 hours MACD – The MACD for ETH/USD is slowly losing momentum in the bearish zone.
4 hours RSI (Relative Strength Index) – The RSI for ETH/USD is still below the 40 level.
Key Support Levels – $2,900, followed by the $2,800 zone.
Key Resistance Levels – $3,200 and $3,400.
Source: livebitcoinnews.com
View original post


