Bitcoin Cash Analysis: Retest of $400 Possible Before Fresh Increase
- Bitcoin cash price rallied sharply above $700 before correcting lower against the US Dollar.
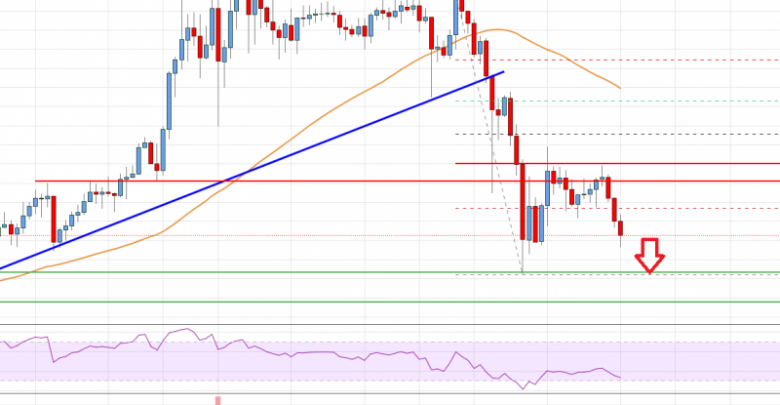
- The price is now trading well below $600 and the 55 simple moving average (4-hours).
- There was a break below a major bullish trend line with support near $660 on the 4-hours chart of the BCH/USD pair (data feed from Coinbase).
- The pair could continue to move down towards $415 and $400 before it could start a fresh increase.
Bitcoin cash price is consolidating losses after a sharp decline from well above $700 against the US Dollar, similar to bitcoin. BCH/USD could retest $400 before the bulls appear again.
Bitcoin Cash Price Analysis
There was a strong increase in bitcoin cash price above the $600 and $650 levels. BCH price even cleared the $700 level and the 55 simple moving average (4-hours).
However, the price struggled to clear the $750 barrier. A high was formed near $738 before the price started a strong decline. There was a break below the $650 support zone and the 55 simple moving average (4-hours).
There was also a break below a major bullish trend line with support near $660 on the 4-hours chart of the BCH/USD pair. The pair dived below the $600 and $550 levels. It traded as low as $444 and it is currently consolidating losses.
It corrected above the 23.6% Fib retracement level of the recent dive from the $738 high to $444 low. However, the bears remained active near the $550 and $560 levels.
There was no test of the 50% Fib retracement level of the recent dive from the $738 high to $444 low. The price is showing bearish signs and trading well below $550. An initial support on the downside is near the $450 zone. The first major support is near the $415 level, below which the price might test $400.
On the upside, the price must settle above $550 for a fresh increase. A clear break above the $550 and $560 levels is must for a steady rise towards the $600 and $650 levels.

Bitcoin Cash Price
Looking at the chart, bitcoin cash price is clearly trading well below $600 and the 55 simple moving average (4-hours). Overall, the price could continue to move down towards $415 and $400 before it could start a fresh increase.
Technical indicators
4 hours MACD – The MACD for BCH/USD is gaining pace in the bearish zone.
4 hours RSI (Relative Strength Index) – The RSI for BCH/USD is now well below the 50 level.
Key Support Levels – $450 and $400.
Key Resistance Levels – $550 and $650.
Source: livebitcoinnews.com
View original post


