- Ripple price is gaining pace above the $0.2480 and $0.2500 resistance levels against the US dollar.
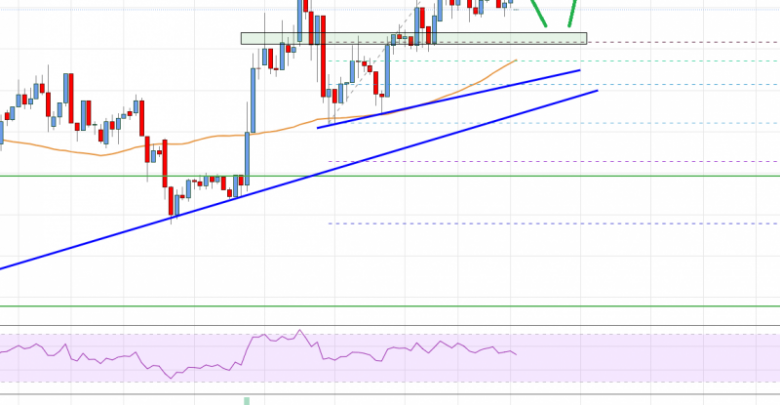
- There is a key bullish trend line forming with support near $0.2480 on the 4-hours chart of the XRP/USD pair (data source from Bittrex).
- The pair is likely to climb further above $0.2600 as long as it is above $0.2455.
Ripple price is trading is a positive zone above $0.2500 against the US Dollar. XRP price is likely to continue higher if it clears the $0.2600 resistance zone.
Ripple Price Analysis
In the past few sessions, there was a steady rise in ripple price above the $0.2455 resistance against the US Dollar. The XRP/USD pair broke the $0.2500 resistance level to move further into a positive zone.
There was also a close above the $0.2500 level and the 55 simple moving average (4-hours). A high is formed near $0.2607 and the price is currently consolidating gains. It corrected lower below the $0.2575 level.
There was also a break below the 23.6% Fib retracement level of the upward move from the $0.2410 low to $0.2607 high. On the downside, the first major support is near the $0.2510 and $0.2500 levels (a multi-touch zone).
The 50% Fib retracement level of the upward move from the $0.2410 low to $0.2607 high is also near the $0.2510 level. Moreover, there is a key bullish trend line forming with support near $0.2460 on the 4-hours chart of the XRP/USD pair.
The main support forming near the $0.2450 level (the previous breakout zone). A downside break below the trend line support and $0.2450 may perhaps start a steady decline. The next major support is near the $0.2350 level.
On the upside, the $0.2580 and $0.2600 levels are initial hurdles. A clear break above the $0.2600 level is likely to accelerate the pair towards the $0.2650 and $0.2660 levels. The next major resistance is near the $0.2720 level, above which the price may even test the $0.2850 level.

Ripple Price
Looking at the chart, ripple price is clearly trading nicely above $0.2500 and the 55 simple moving average (4-hours). Therefore, the price is likely to climb further above $0.2600 as long as it is above $0.2455.
Technical indicators
4 hours MACD – The MACD for XRP/USD is showing positive signs in the bullish zone.
4 hours RSI (Relative Strength Index) – The RSI for XRP/USD is now correcting lower towards the 50 level.
Key Support Levels – $0.2500, $0.2480 and $0.2450.
Key Resistance Levels – $0.2580 and $0.2600.
Source: livebitcoinnews.com
View original post


