- Bitcoin cash price is currently recovering from the $200 support zone against the US Dollar.
- The price is facing a few important hurdles near $220 and the 55 simple moving average (4-hours).
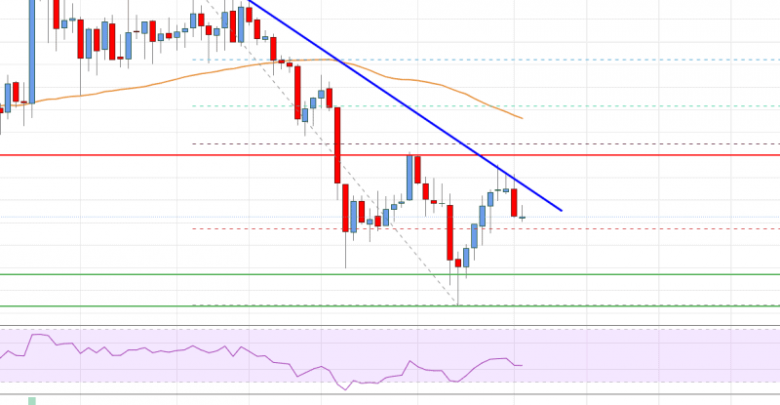
- There is a connecting bearish trend line forming with resistance near $218 on the 4-hours chart of the BCH/USD pair (data feed from Coinbase).
- The pair could either rally above the $220 resistance or reverse back towards the $200 handle.
Bitcoin cash price is holding the key $200 support zone against the US Dollar. BCH/USD could struggle to recover unless there is a clear break above the $220 resistance.
Bitcoin Cash Price Analysis
This week, bitcoin cash price extended its decline below the $230 support against the US Dollar. BCH price even broke the $220 support level to move into a bearish zone.
There was also a close below the $220 level and the 55 simple moving average (4-hours). A low is formed near the $203 level and the price is currently recovering higher. There was a break above the $210 level, plus the price recovered above the 23.6% Fib retracement level of the downward move from the $238 swing high to $203 low.
However, the price is facing a major hurdle near the $218-$220 zone. There is also a connecting bearish trend line forming with resistance near $218 on the 4-hours chart of the BCH/USD pair.
The 50% Fib retracement level of the downward move from the $238 swing high to $203 low is also waiting near the $221 level to act as a hurdle. The next key resistance is near the $225 level and the 55 simple moving average (4-hours).
A clear break above the $220 and $225 resistance levels is needed for a fresh increase. In the stated case, it could easily break $230 and continue higher towards the $240 level.

Bitcoin Cash Price
Looking at the chart, bitcoin cash price is facing a few important hurdles near $220 and the 55 simple moving average (4-hours). The price could either rally above the $220 resistance or reverse back towards the $200 handle.
Technical indicators
4 hours MACD – The MACD for BCH/USD is struggling to gain pace in the bullish zone.
4 hours RSI (Relative Strength Index) – The RSI for BCH/USD is still well above the 50 level.
Key Support Levels – $210 and $205.
Key Resistance Levels – $220 and $225.
Source: livebitcoinnews.com
View original post


