- Bitcoin cash price started a major decline from well above the $300 level against the US Dollar.
- The price is currently trading well below the $280 level and the 55 simple moving average (4-hours).
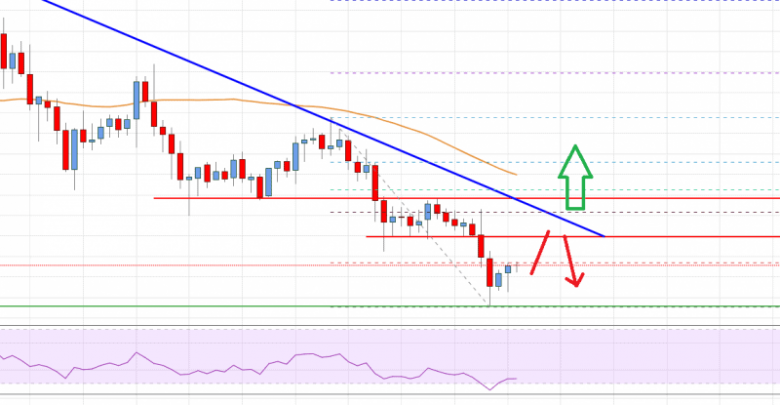
- There is a major bearish trend line forming with resistance near $272 on the 4-hours chart of the BCH/USD pair (data feed from Coinbase).
- The pair could start a fresh increase if there is a clear break above the $272 and $275 levels.
Bitcoin cash price is declining and it is trading in a bearish zone below $280 against the US Dollar. BCH/USD is likely to continue lower as long as it is below $272.
Bitcoin Cash Price Analysis
Earlier this week, bitcoin cash price started a steady decline below the $300 support against the US Dollar. BCH price even traded below the $280 support and the 55 simple moving average (4-hours).
The decline was such that the price broke the $265 support and traded to a new weekly low at $285. It is currently correcting higher and trading above the $265 level. The price is approaching the 23.6% Fib retracement level of the recent decline from the $295 high to $258 low.
On the upside, there is a key resistance forming near $270 and $272. There is also a major bearish trend line forming with resistance near $272 on the 4-hours chart of the BCH/USD pair.
Above the trend line, the next resistance is near $275 or the 50% Fib retracement level of the recent decline from the $295 high to $258 low. The next major resistance is near the $280 level and the 55 simple moving average (4-hours).
To move into a positive zone, the price must break the trend line resistance and then gain pace above the $280 level. Conversely, the price may perhaps continue to move down below the $260 support.
If there is a bearish close below the $260 level, the price could extend towards the $250 support. The next major support is near the $242 level.

Bitcoin Cash Price
Looking at the chart, bitcoin cash price is clearly trading in a bearish zone below $272 and $280. It could start a fresh increase if there is a clear break above the $272 and $275 levels.
Technical indicators
4 hours MACD – The MACD for BCH/USD is currently losing momentum in the bearish zone.
4 hours RSI (Relative Strength Index) – The RSI for BCH/USD is currently well below the 40 level.
Key Support Levels – $260 and $250.
Key Resistance Levels – $272 and $280.
Source: livebitcoinnews.com
View original post


