Ripple Price Analysis: XRP Remains Supported Despite Recent Pullback
- Ripple price started a major downside correction from close to $0.2550 resistance against the US dollar.
- The price declined below $0.2400, but it is still trading nicely above the $0.2260 support area.
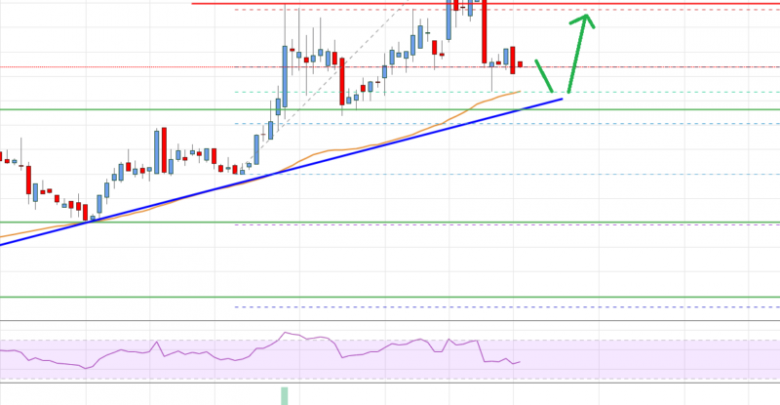
- There is a key bullish trend line with support near $0.2265 on the 4-hours chart of the XRP/USD pair (data source from Bittrex).
- The pair is likely to bounce back above $0.2400 unless it breaks the $0.2200 support area.
Ripple price is correcting gains from the $0.2540 high against the US Dollar. XRP price remains well supported for a fresh increase as long as it is above $0.2200.
Ripple Price Analysis
In the past few days, ripple price followed a nice uptrend from the $0.2000 support area against the US Dollar. XRP/USD broke many hurdles near the $0.2200 level to move into a positive zone.
Besides, there was a close above the $0.2200 area and the 55 simple moving average (4-hours). The bulls gained traction and the price rallied above the $0.2300 and $0.2400 levels. Finally, the price spiked above $0.2500 and a high was formed near $0.2540.
Recently, there was a sharp downside correction below the $0.2500 level. Moreover, the price traded below the $0.2400 support. The bears even pushed the price below the 50% Fib retracement level of the upward move from the $0.2001 low to $0.2195 high.
An initial support on the downside is near the $0.2095 level. It represents the 50% Fib retracement level of the upward wave from the $0.2099 low to $0.2540 high.
However, ripple price found support near the $0.2265 level. More importantly, there is a key bullish trend line with support near $0.2265 on the 4-hours chart of the XRP/USD pair.
The 61.8% Fib retracement level of the upward wave from the $0.2099 low to $0.2540 high is also near the $0.2265 area to provide support. The next major support is near the $0.2205 and $0.2200 levels.
If the price settles below $0.2200 and the 55 simple moving average (4-hours), it could turn bearish. Conversely, the price is likely to bounce back above $0.2350 and $0.2400.
A successful break and follow through above $0.2400 and $0.2410 might lead the price towards $0.2500 in the near term.

Looking at the chart, ripple price is correcting lower, but it is approaching a couple of important supports near $0.2265 and $0.2205. As long as there is no close below $0.2200, it could start a fresh increase.
Technical indicators
4 hours MACD – The MACD for XRP/USD is losing momentum in the bearish zone.
4 hours RSI (Relative Strength Index) – The RSI for XRP/USD is currently rising and it could surpass the 50 level.
Key Support Levels – $0.2265, $0.2230 and $0.2200.
Key Resistance Levels – $0.2350 and $0.2410.
Source: livebitcoinnews.com
View original post


