
Crypto Market Update: Bitcoin, Ethereum, XRP & BNB Price Analysis 29th Nov
Bitcoin price likely formed a short term bottom near the $6,610 level. BTC/USD is currently recovering, but it is approaching a major breakout resistance near the $7,675 level, above which it could rally significantly.
Similarly, there was a decent recovery initiated in most major altcoins, including Ethereum (ETH), ripple (XRP), bitcoin cash (BCH), litecoin (LTC), binance coin (BNB), stellar (XLM), ADA, EOS, and TRX. Overall, the crypto market is showing signs of more gains, but also facing a couple of important hurdles.

Read: Broker Comparison Guide
Key Takeaways:
- Bitcoin price is now trading above $7,300 and facing hurdles near $7,675 and $7,700.
- Ethereum price is also facing a strong resistance near the $152.80 and $156.05 levels.
- Ripple price is likely to fail near the $0.2300 and $0.2365 resistance levels.
- EOS price is now placed nicely above the $2.500 pivot level.
- Binance coin (BNB) seems to be forming a bullish breakout pattern with resistance near $16.30.
- Litecoin price is struggling to surpass above the $58.80 and $60.00 resistance levels.
- EXMR rallied more than 240% and VRA gained nearly 140% in the past 7 days.
Bitcoin Price Analysis
Bitcoin price extended its decline below the $7,000 and $6,500 support levels. BTC/USD traded close to the $6,500 level, formed a low near $6,614 and it is currently correcting higher.
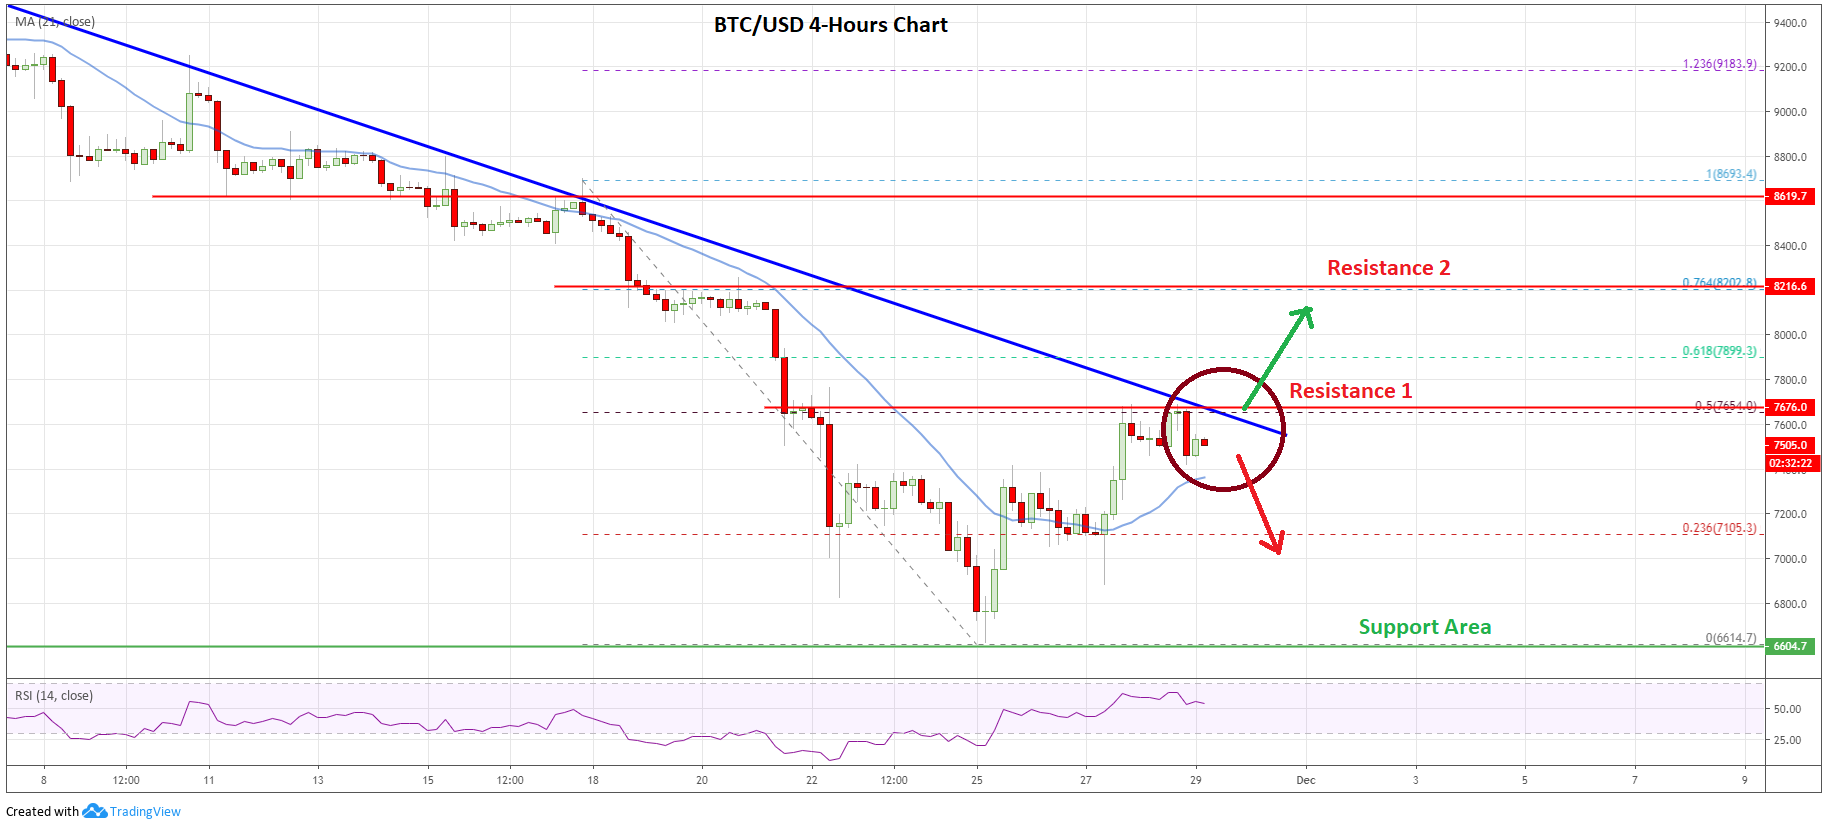
Bitcoin Price Chart: Click to Enlarge
Looking at the 4-hours chart, the price started a recovery above the $7,000 and $7,200 resistance levels. Besides, the price settled above the $7,200 level and the 21 simple moving average (4-hours).

The price even climbed above the 23.6% Fib retracement level of the downward move from the $8,693 high to $6,614 swing low. However, the price ran into a major resistance area near the $7,675 level.
It coincides with the 50% Fib retracement level of the downward move from the $8,693 high to $6,614 swing low. Moreover, there is a major bearish trend line forming with resistance near $7,650 level on the same chart.
Therefore, an upside break above the $7,675 and $7,700 levels is needed for more gains in the near term. The next major resistance for bitcoin price is near the $8,200 area.
An intermediate resistance is near the 61.8% Fib retracement level of the downward move from the $8,693 high to $6,614 swing low. If the price continues to rise, there are chances of a run towards the $8,650 area.
Conversely, the price could fail to rise above the $7,675 and $7,700 resistance levels. In the mentioned case, bitcoin price is likely to resume its decline below the $7,200 support area.
The main support is near the $7,000 level, below which the price is likely to revisit the $6,600 and $6,500 support levels in the near term.
Ethereum Price Analysis
Ethereum price also followed a similar pattern and started a nice recovery wave after trading to a new monthly low near the $133.61 level. ETH/USD surpassed the $141.50 and $144.60 resistance levels to start the current recovery wave.

Ethereum Price Chart: Click to Enlarge
Looking at the 4-hours chart, the price even climbed above the $148.00 resistance and the 21 simple moving average (4-hours). More importantly, there was a break above the 23.6% Fib retracement level of the downward move from the $186.80 high to $133.61 low.
Finally, there was a break above the $150.00 resistance area. At the moment, the price is trading near a major hurdle at $154.50 and $156.00.
Besides, there is a key bearish trend line in place with resistance near the $153.00 level on the same chart. If there is an upside break above the trend line, the price could rise towards the $160.00 resistance area.
The 50% Fib retracement level of the downward move from the $186.80 high to $133.61 low is near the $160.00 level to act as a resistance.
If there are more gains, the price is likely to continue higher towards the $166.00 and $172.00 resistance levels. Conversely, the price might struggle to rise further in the near term above $153.00 and $156.00.
On the downside, an initial support is near the $150.20 level and the 21 simple moving average (4-hours). If there is a downside break below the $150.20 support, Ethereum price might continue to move down.
The main support is near the $146.60 level, below which there is a risk of a fresh bearish wave. In the mentioned case, the price is likely to test the $142.20 and $138.50 support levels.
Ripple Price Analysis
Ripple price declined sharply towards the major $0.2000 support area against the US Dollar. The XRP/USD pair traded as low as $0.2026 and recently started a nice upside correction.

Ripple Price Chart: Click to Enlarge
Looking at the 4-hours chart, the price recovered above the $0.2120 and $0.2125 resistance levels. Besides, there was a close above the $0.2150 resistance and the 21 simple moving average (4-hours).
The price settled above the 23.6% Fib retracement level of the last major decline from the $0.2594 high to $0.2026 low. Finally, it tested the $0.2300 and $0.2310 resistance levels.
It seems like the 50% Fib retracement level of the last major decline from the $0.2594 high to $0.2026 low is currently acting as a resistance.
Moreover, there is a major bearish trend line in place with resistance near the $0.2340 level on the same chart. A clear break above the trend line resistance could push the price further higher.
The next major resistance is near the $0.2460 level, which coincides with the 76.4% Fib retracement level of the last major decline from the $0.2594 high to $0.2026 low.
On the flip side, ripple price might struggle to continue higher above the $0.2300 and $0.2340 resistance levels. An initial support is near the $0.2230 level and the 21 simple moving average (4-hours).
If there is a downside break below the $0.2230 and $0.2200 levels, the price is likely to resume its decline towards the $0.2000 support area in the near term.
Binance Coin Price Analysis (BNB/USDT, Binance Exchange)
Binance coin started a nasty decline from the $21.80 resistance area. BNB price broke many supports such as $19.20 and $17.90. Moreover, there was a break below the $16.50 support and the 21 simple moving average (4-hours).

Binance Coin Price Chart: Click to Enlarge
Looking at the 4-hours chart, the price traded close to the $13.80 level and a low was formed near the $13.92 level. Recently, the price started an upside correction above $14.00 similar to bitcoin.
It broke the $15.00 resistance and the 21 simple moving average (4-hours). Besides, there was a break above the 23.6% Fib retracement level of the last major decline from the $21.80 high to $13.92 low.
At the moment, the price is struggling to clear the $16.00 and $16.25 resistance levels. Moreover, there is a crucial bearish trend line in place with resistance near $16.25 on the same chart.
It seems like there is an inverse head and shoulders pattern forming with resistance near $16.00. Therefore, a clear break above the $16.00 and $16.25 resistance levels may open the doors for more gains in the near term towards $19.20.
Top Gainers
During the past 7 days, a few small cap altcoins rallied more than 100%, including EXMR, VRA, DMT, BOK, DXT and DATA (trading volume more than $50K). Out of these, EXMR rallied more than 240% and VRA gained nearly 140%.
Overall, bitcoin price is showing positive signs above the $7,200 and $7,000 support levels. Having said that, BTC/USD needs to gain momentum above the $7,600 and $7,700 resistance levels to start another increase in the coming days. If not, there is a risk of a fresh decline in BTC and altcoins such as Ethereum, ripple, bitcoin cash, litecoin, XLM, ADA, TRX, EOS, ICX, BNB, XMR, NEO, and WTC.
The market data is provided by TradingView, Bitfinex.


eToro Risk Warning: 75% of retail investor accounts lose money when trading CFDs with this provider. You should consider whether you can afford to take the high risk of losing your money.
You have Successfully Subscribed!
Source: blockonomi.com
View original post


