
Ethereum Price Analysis: After Breaking Below $150, Can ETH Recover?
Summary
- Ethereum witnessed disastrous two weeks of trading after dropping by a steep 22% and falling towards the $146 level.
- The cryptocurrency is trapped within a symmetrical triangle against Bitcoin.
- Ethereum looks to be shaping up for a rebound as the Stochastic RSI is primed for a bullish crossover on both USD and BTC charts.
Key Support & Resistance Levels
ETH/USD
Support: $130, $120, $105.
Resistance: $160, $170, $180
ETH/BTC:
Support: 0.020BTC, 0.0195BTC, 0.0190BTC.
Resistance: 0.021BTC, 0.0217BTC, 0.0235BTC
ETH/USD – Trapped In A 4-Month Old Descending Channel
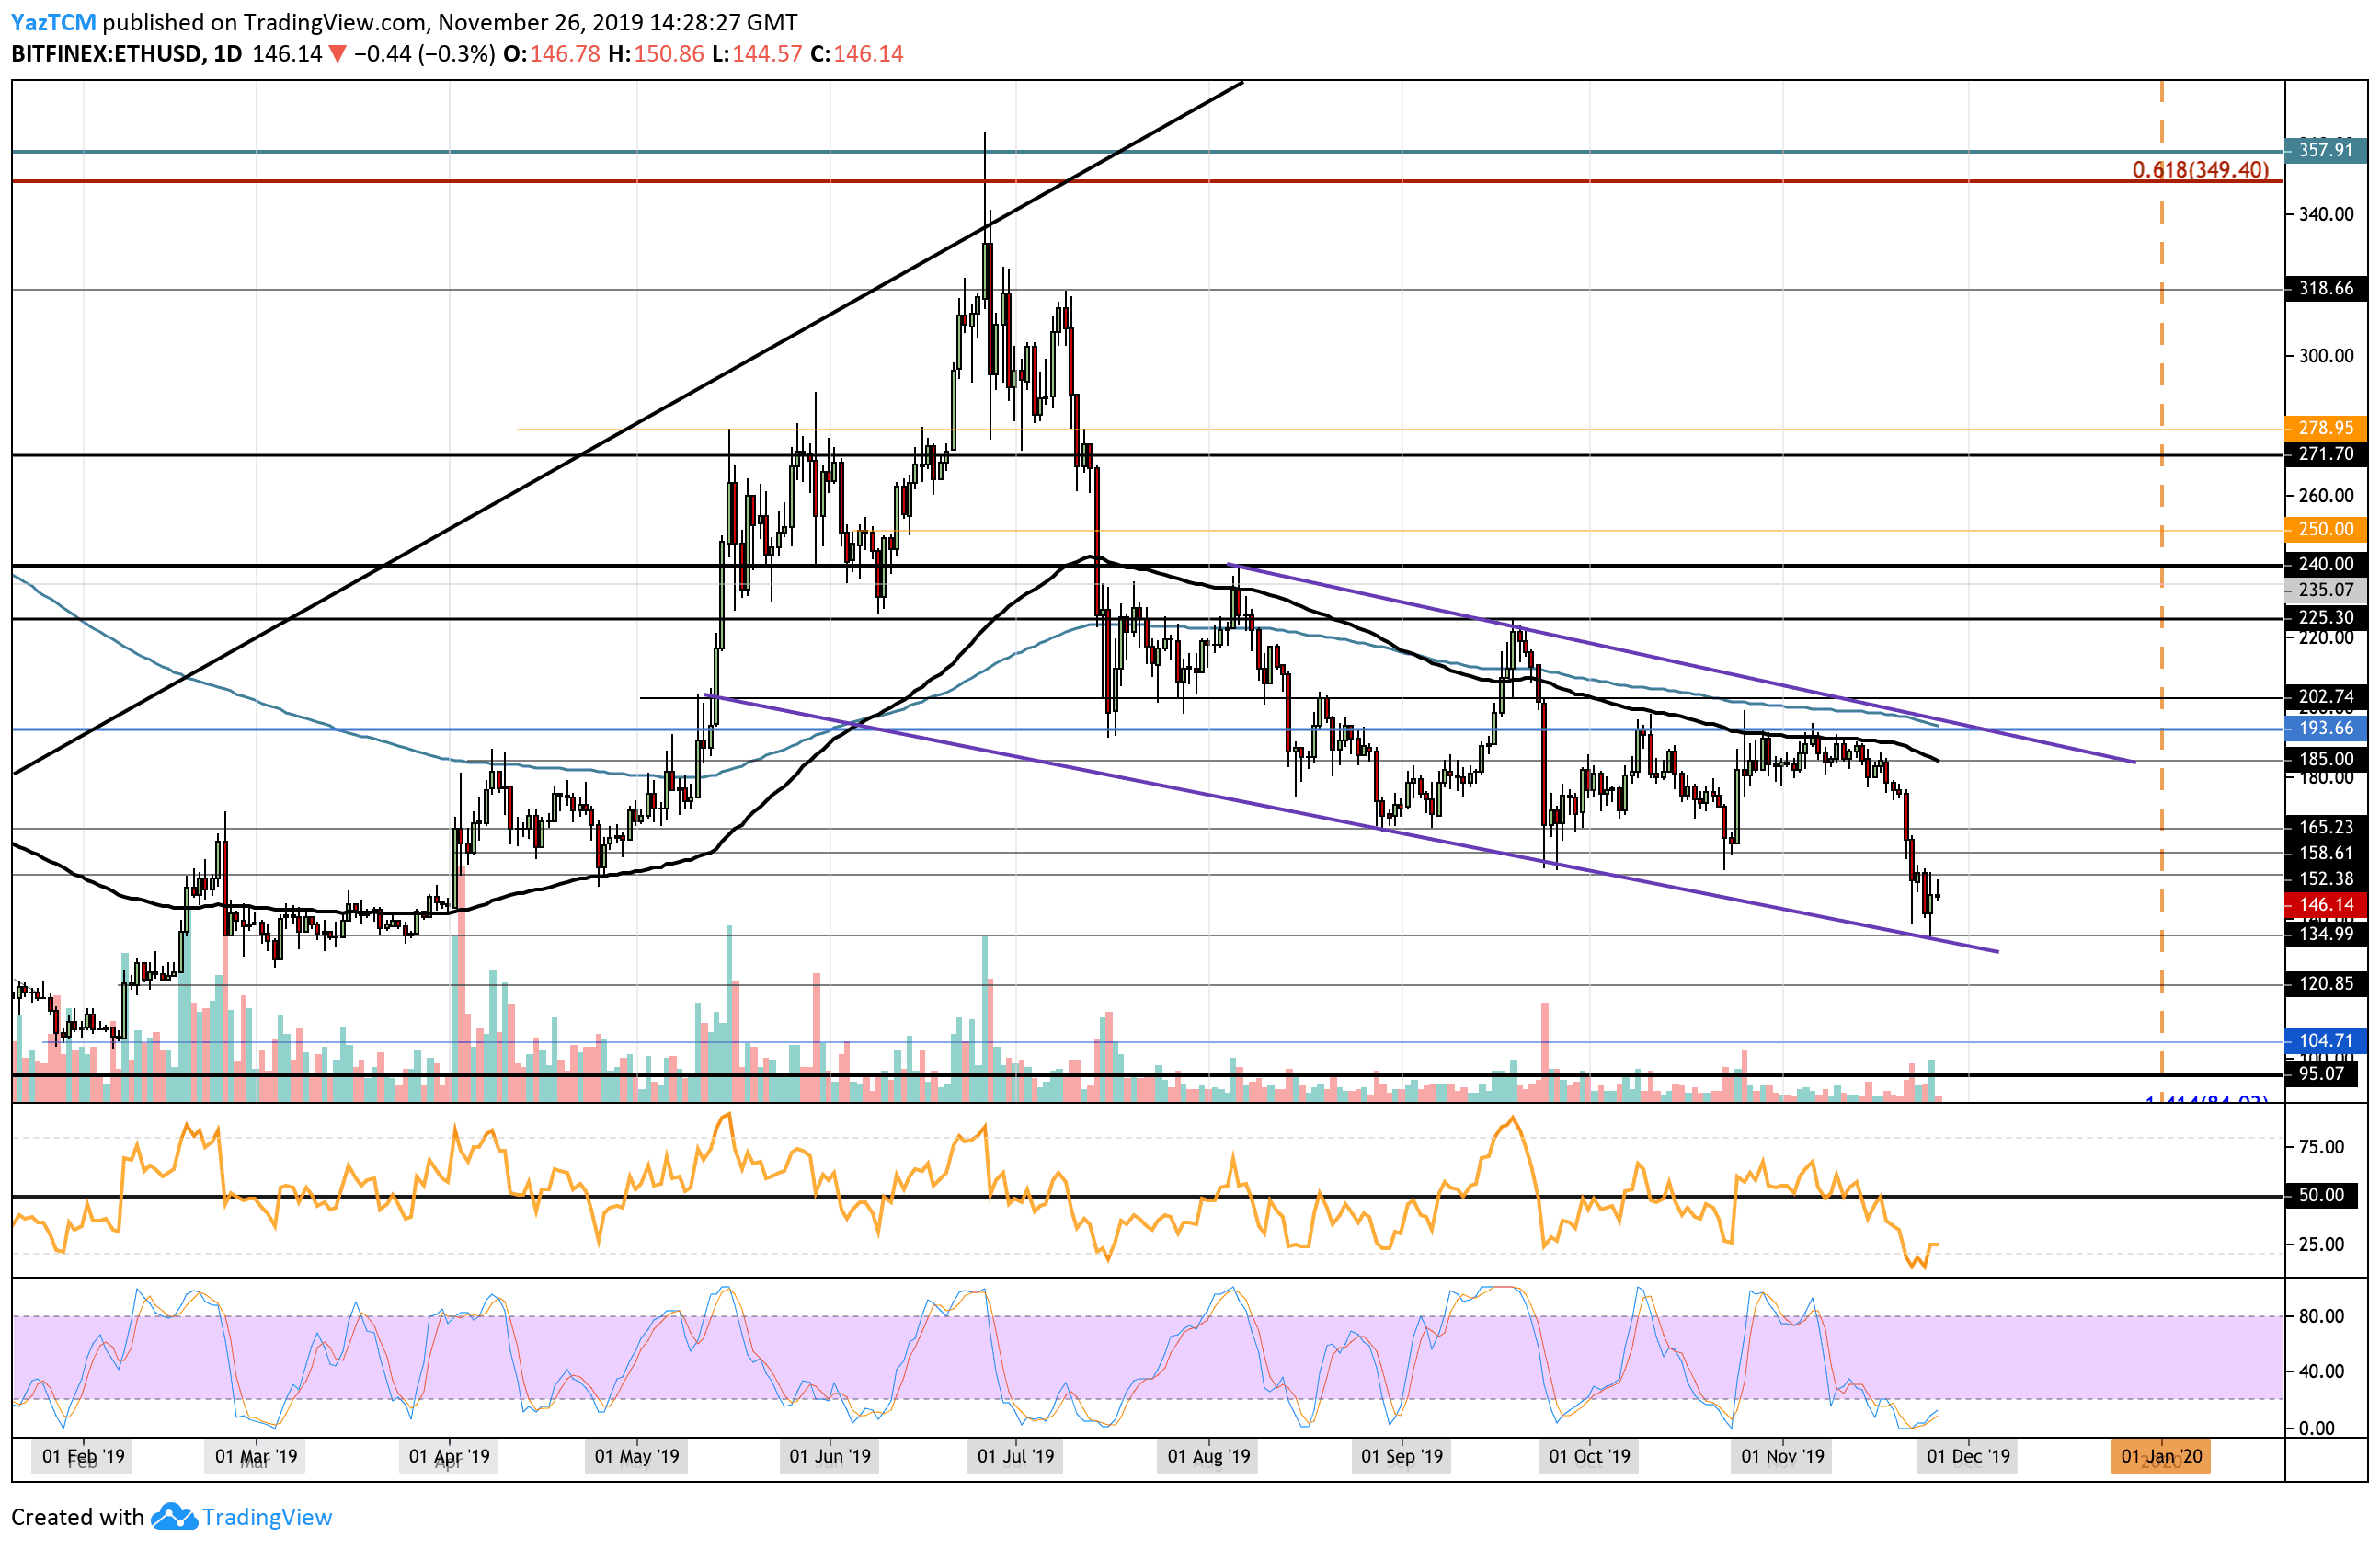
The daily chart shows a 4-month descending channel where ETH has been trapped within. It started the month above $180 but failed to break above the resistance provided there by the 100-days EMA.
During mid-November, the cryptocurrency pulled back from these levels and noted a decline of about 25%. ETH plummetted beneath $150 and fell to as low as $135, which coincides with the lower boundary of the descending channel. It has attempted to rebound from there and it currently trades at around $145. The trading volume remains around the average level but it started to show signs of increasing.
Ethereum Short-Term Price Prediction
If the bulls continue pushing ETH higher above the $150 level, resistance can be expected at $160, $170 and $185 (100-day EMA).
Alternatively, if the sellers push the market lower, support is found at $130, $120, and $105. The $105 level has provided strength for the market during February 2019 and is expected to provide equal support moving forward.
The reason why Ethereum might be on the cusp of a revival is that the Stochastic RSI recently produced a bullish crossover signal in oversold territory. If this can follow-through, ETH could rebound higher.
ETH/BTC – Stuck Inside A Symmetrical Triangle
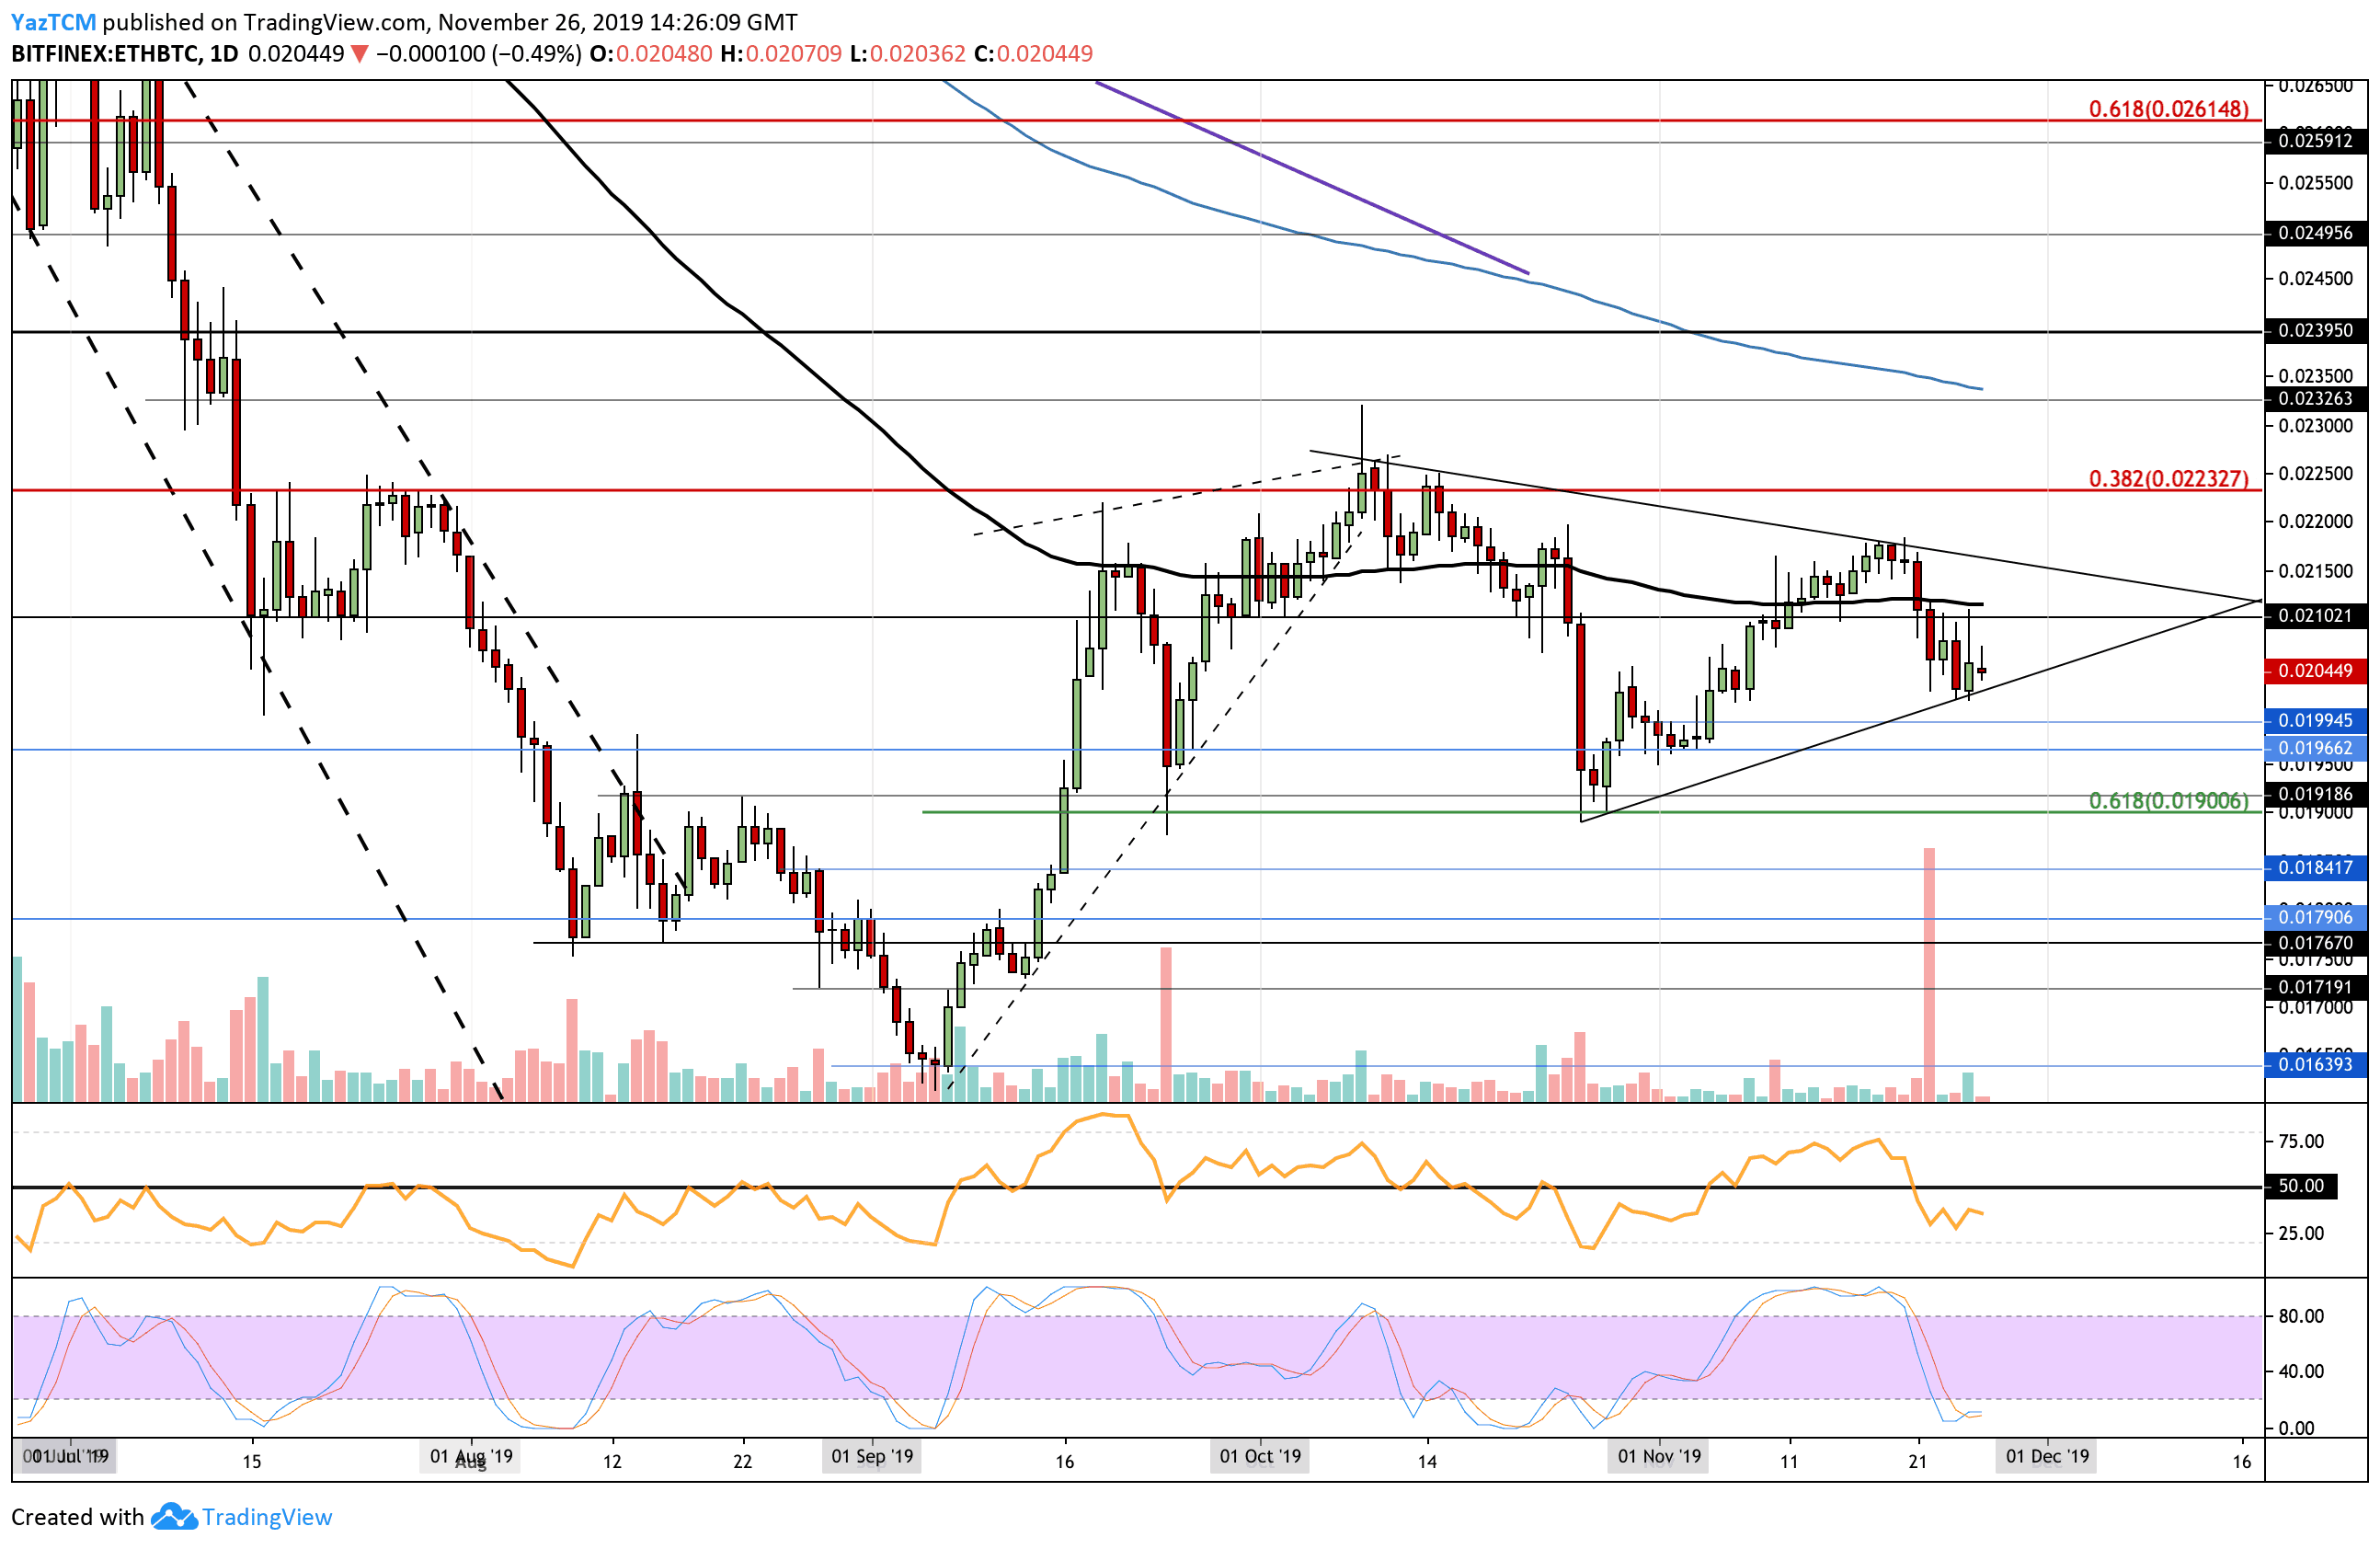
Against Bitcoin, Ethereum has been trapped within a symmetrical triangle for the entire period of November. The cryptocurrency got as high as 0.0218 BTC but met resistance at the upper boundary of the triangle.
ETH recently fell back into the support at the lower boundary as it currently trades at around 0.0205 BTC. A breakout of this triangle will not dictate the next direction that Ethereum will head toward. The trading volume remains very low, and it has to increase for the cryptocurrency to break out.
ETH Short-Term Price Prediction
If the buyers continue to climb higher from the lower boundary, resistance is expected at 0.021 BTC, where lies the 100-days EMA. This is then followed with resistance at the upper edge of the triangle at around 0.0217 BTC. Above the triangle, strong resistance is found at the 200-days EMA at 0.0235 BTC.
On the other hand, if the sellers push Ethereum beneath the triangle, support can be found at 0.020 BTC. After that, support is expected at 0.0195BTC and 0.019BTC, which represents the short-term .618 Fibonacci Retracement level.
Similar to the ETH/USD market, ETH/BTC is shaping up for a revival as the Stochastic RSI produces a bullish crossover signal in oversold territory. For a sign that the selling pressure is fading, the RSI needs to rise back above the 50 level.
Disclaimer: Information found on CryptoPotato is those of writers quoted. It does not represent the opinions of CryptoPotato on whether to buy, sell, or hold any investments. You are advised to conduct your own research before making any investment decisions. Use provided information at your own risk. See Disclaimer for more information.
Cryptocurrency charts by TradingView.
Technical analysis tools by Coinigy.
Source: cryptopotato.com
View original post


