
Ethereum Price Analysis: ETH Slips Below $180 But Bulls May Be Plotting a Comeback
Ethereum has seen a small increase of 0.45% over the past 24 hours and it currently trades at $177.46. Over the past week, ETH dropped by a total of 5.58%, falling beneath the short term consolidation pattern that it was previously trading within.
Ethereum remains the second-largest cryptocurrency as it holds a market cap of $19.26 billion.
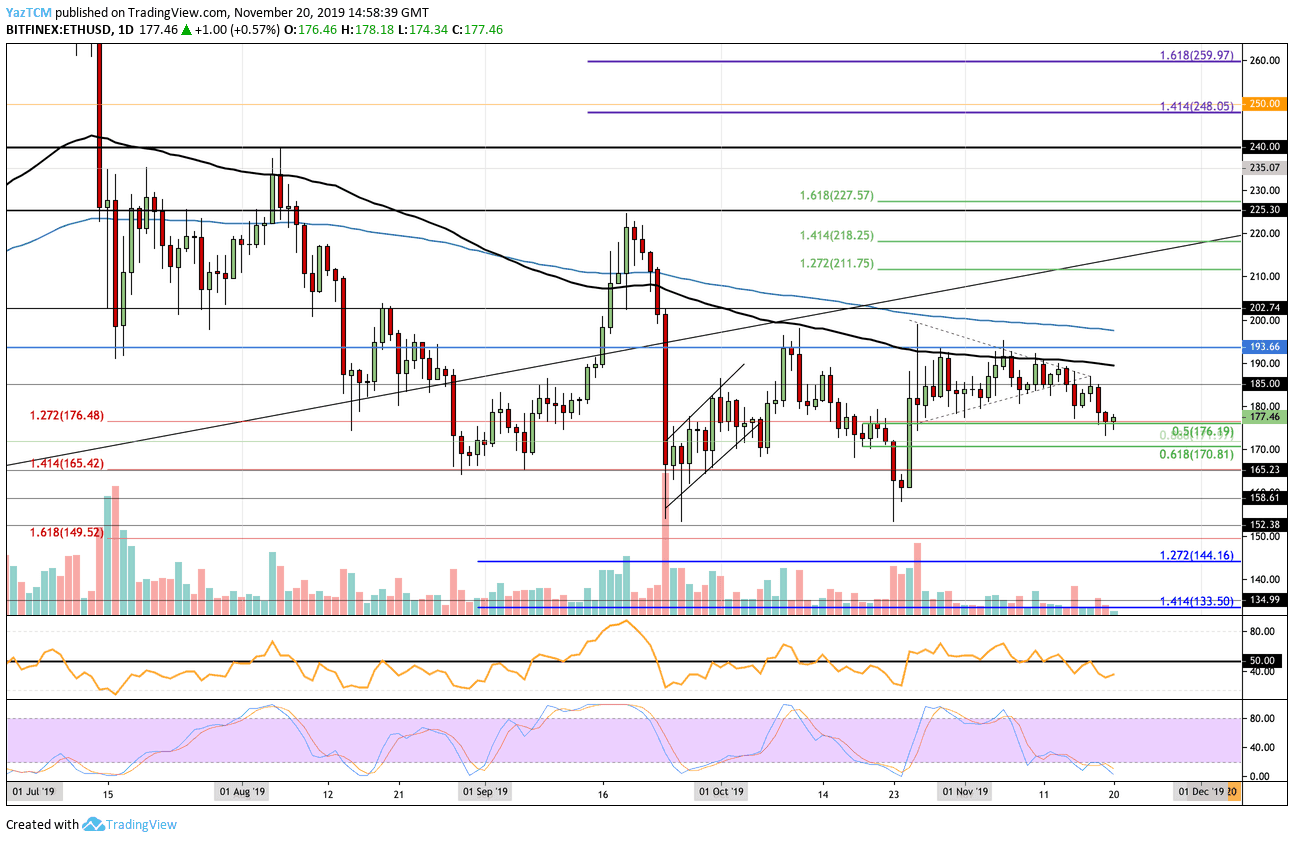
Looking at the ETH/USD 1-day chart:
- Since our last analysis, ETH dropped beneath the symmetrical triangle and fell into the current support at $176.19, provided by a short term .5 Fibonacci Retracement level.
- From above: The nearest level of resistance lies at $180. Above this, resistance is at $185, $189, $194, and $200. The resistance at $200 is bolstered by the 200-days EMA. Higher resistance is found at $202, $211, $218, and $225.
- From below: The nearest level of support lies at $176.19. Beneath this, support can be expected at $181.97, $170.81 (.618 Fib Retracement), and $165. If the selling continues, support is located at $160, $158.61, and $152.38.
- The trading volume has been very low during November 2019.
- The RSI has dipped beneath the 50 level to show that the sellers are in control over the market momentum. However, the Stochastic RSI is in oversold conditions as we wait for a bullish crossover signal to send the market higher.
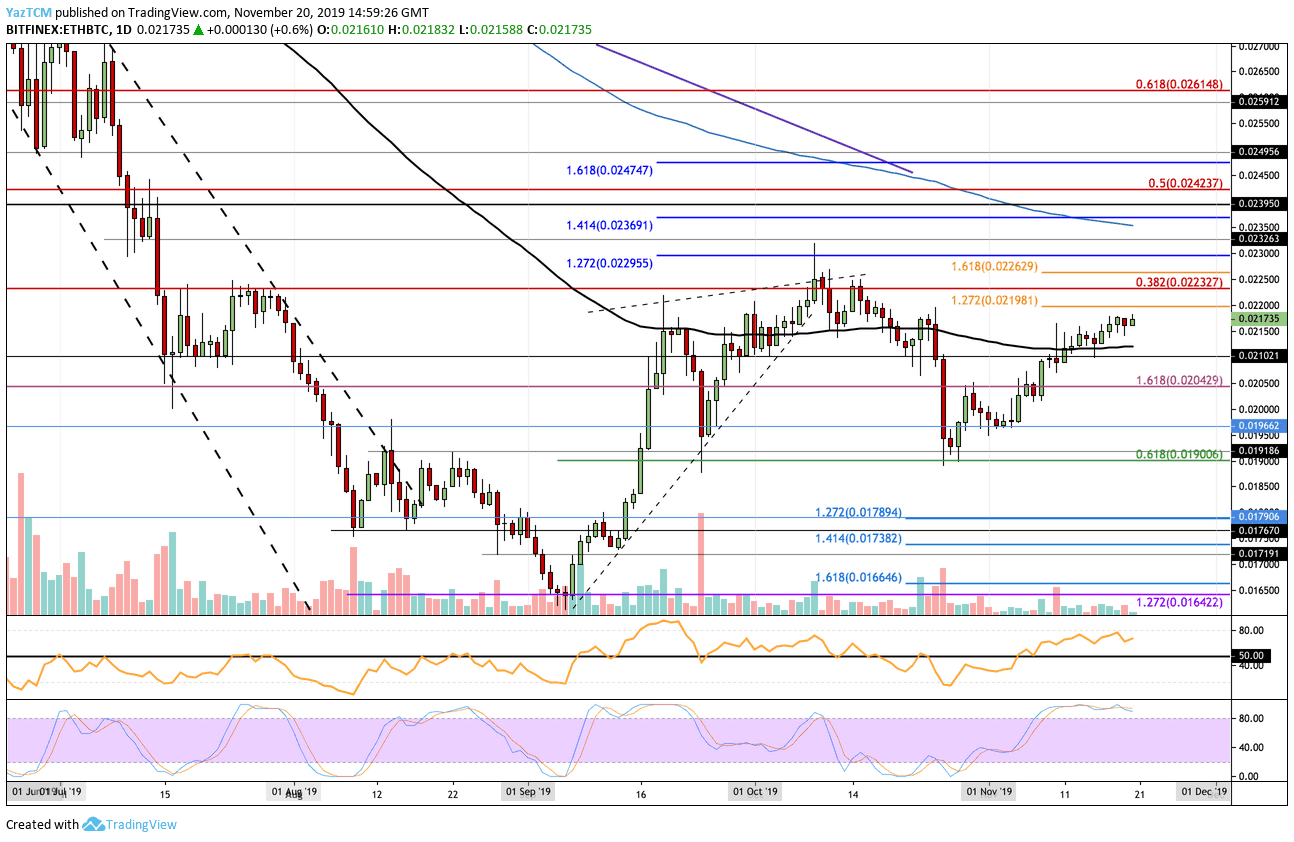
Looking at the ETH/BTC 1-day chart:
- Against BTC, ETH has continued to slowly grind higher as it edges its way toward the 0.022 BTC level.
- From above: The nearest level of resistance lies at 0.02198 BTC (1.272 Fibonacci Extension level). Above 0.022 BTC, resistance is located at 0.02232 (long term bearish .382 Fibonacci Retracement), 0.02262 BTC, 0.02296 BTC, and 0.02362 BTC. Higher resistance is expected at 0.02350 BTC (200-days EMA), 0.02369 BTC, and 0.02395 BTC.
- From below: The nearest level of support lies at 0.02150 BTC. Beneath this, support is located at 0.02120 BTC and 0.021 BTC. Lower support is found at 0.020 BTC, 0.01966 BTC, and 0.019 BTC.
- The trading volume remains very low in November.
- The RSI is in the bullish favor as it trades well above the 50 level. However, the Stochastic RSI is also overbought as we wait for a bullish crossover signal to send the market lower.
Disclaimer: Information found on CryptoPotato is those of writers quoted. It does not represent the opinions of CryptoPotato on whether to buy, sell, or hold any investments. You are advised to conduct your own research before making any investment decisions. Use provided information at your own risk. See Disclaimer for more information.
Cryptocurrency charts by TradingView.
Technical analysis tools by Coinigy.
Source: cryptopotato.com
View original post


