
Bitcoin Price Analysis: BTC At Short-Term Risk, Facing The Critical 200-days MA Line
For the past ten days, Bitcoin is trading inside a tight range, which is very unlikely for the primary cryptocurrency.
We can almost say that the past week was boring for the heavy crypto traders. However, this stability could come up to an end very shortly.
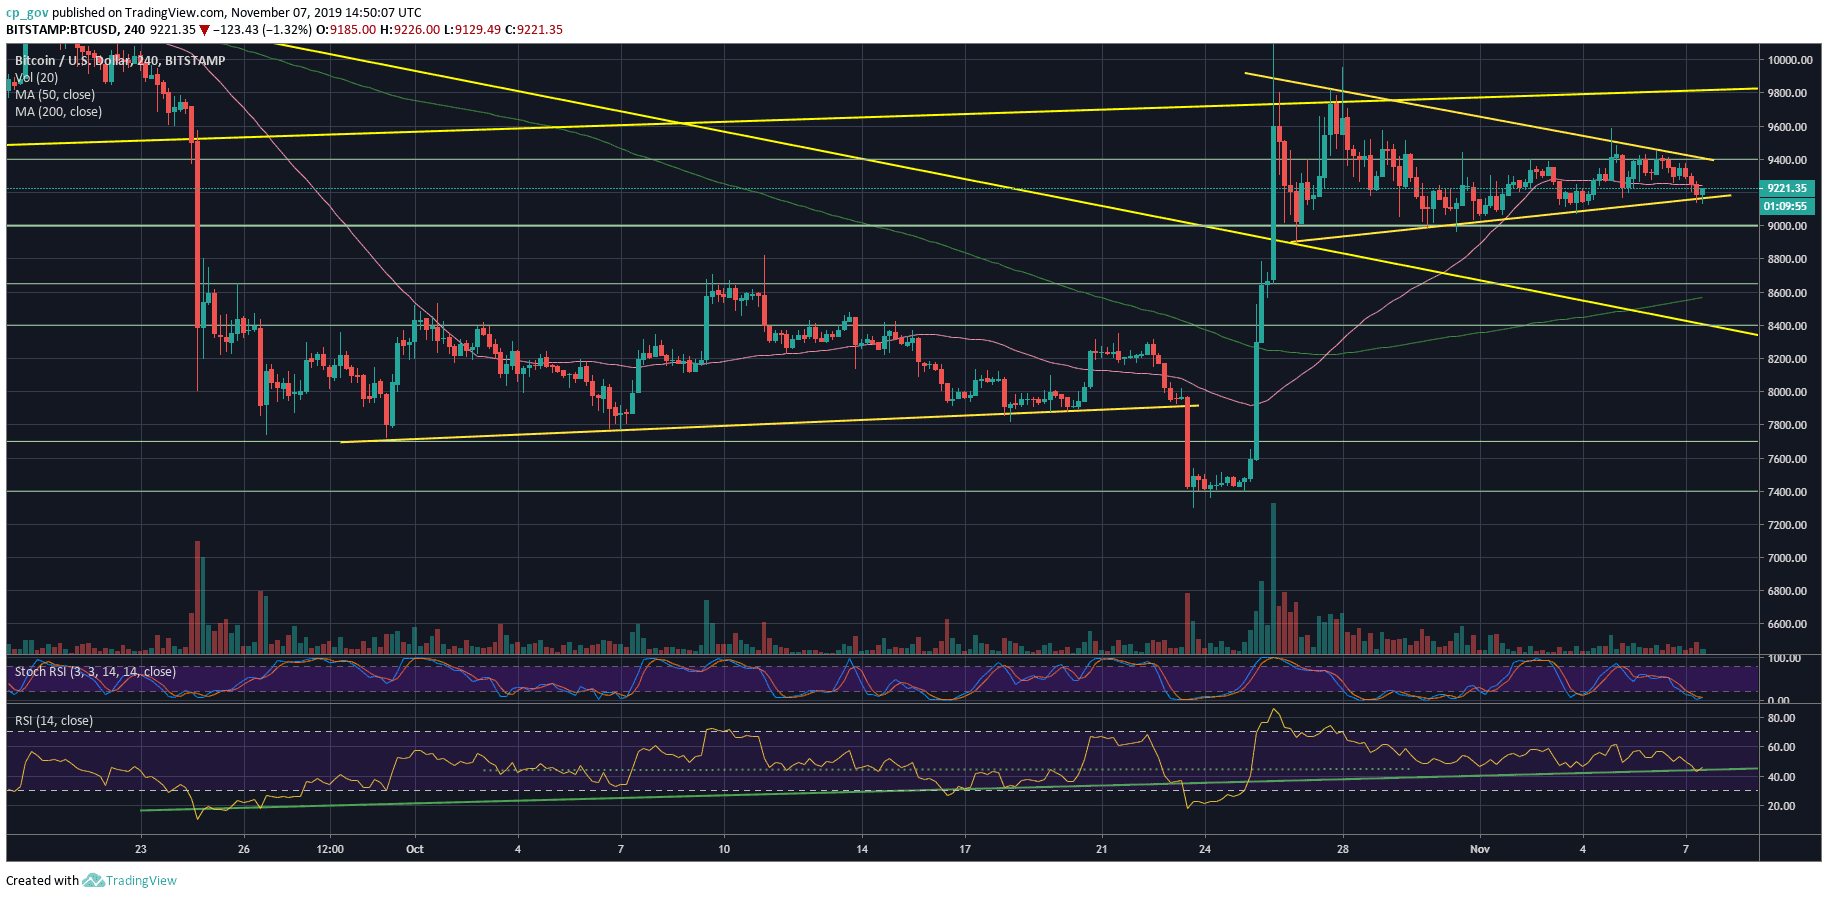
Looking on the following 4-hour chart, we can see that Bitcoin is forming a symmetrical triangle with a Bullish bias, from the fact that it can turn into a bull flag very quickly (in the case of a breakup).
Despite the above said, since yesterday, following a failed retest of the upper trend-line around $9,450, Bitcoin is losing momentum slowly, and as of writing this, the coin is struggling to stay above the ascending trend-line (the lower angle of the triangle).
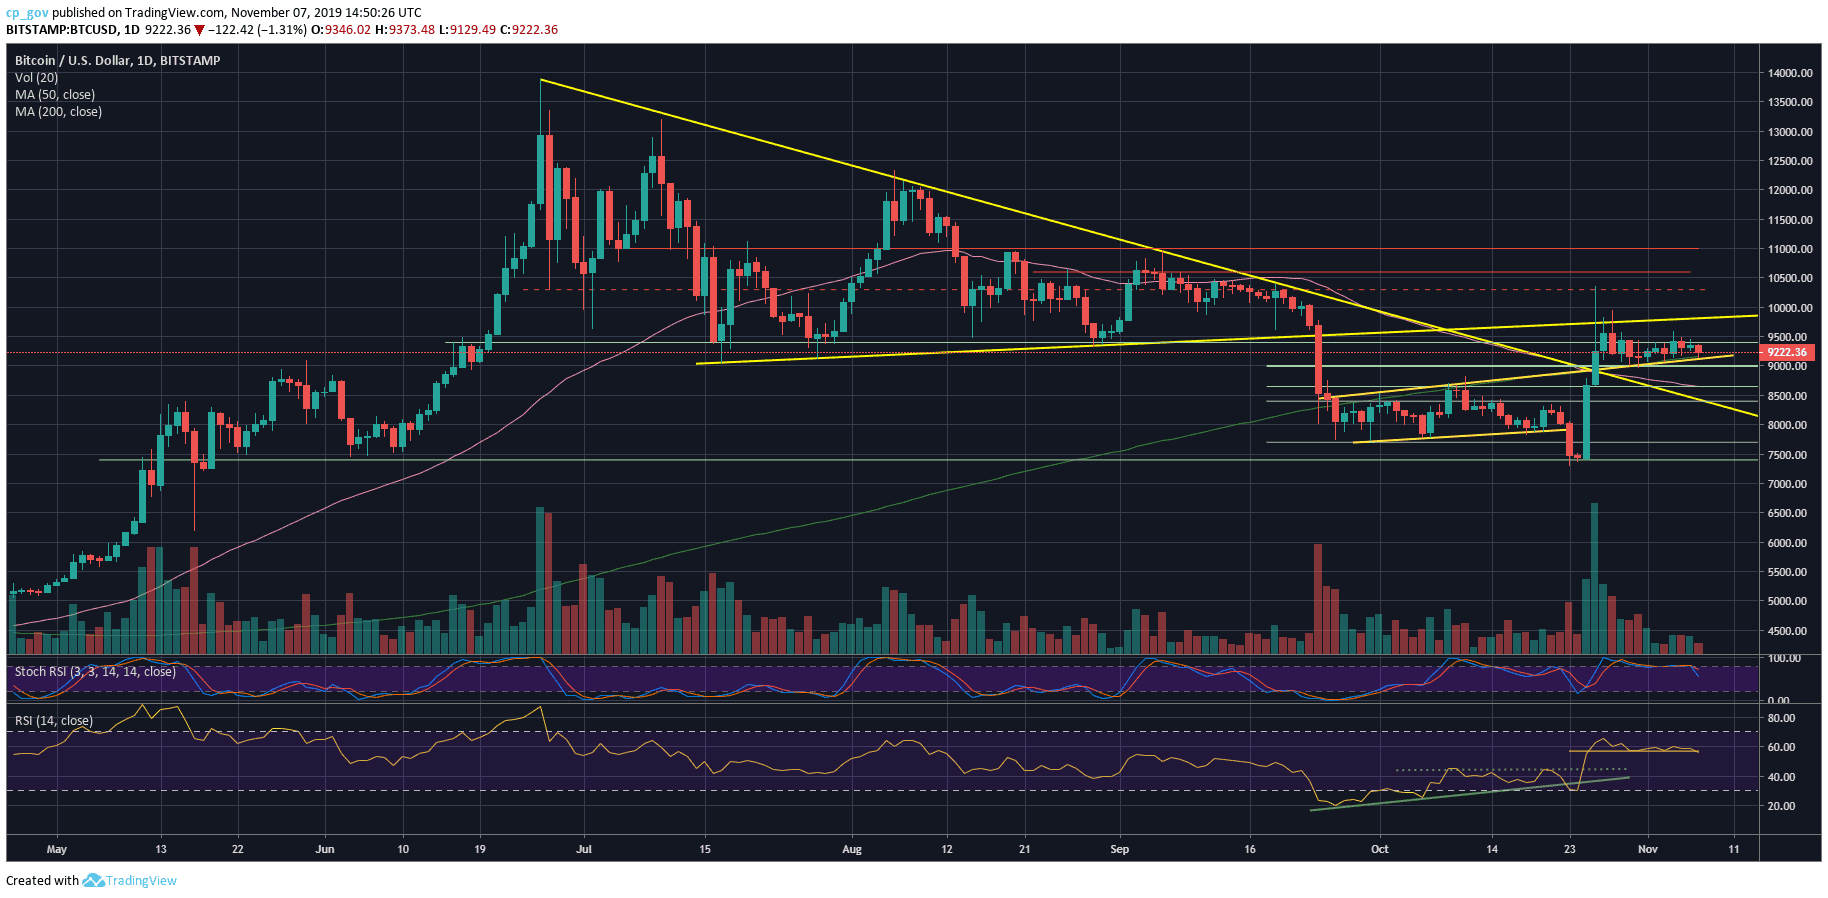
The last comes together with the critical 200-days moving average line. The 200-days MA is a significant indicator to distinguish between bear and bull markets.
After exactly a month (September 26 to October 26) trading beneath it, Bitcoin returned above for the sake of the Bulls. However, since then, the MA line had been tested as support four times over the past eight days.
The more times a support level is being tested, the higher the change it will get broken down. Being said that, Bitcoin is now going through its fifth test of the MA-200 line, hoping to be saved following another green support.
The RSI Indicator: Along with the decision point of the Bitcoin price, the RSI indicator is testing the 57-horizontal support for the third time over the past ten days. Just like the price support, the RSI tells a similar story.
Trading volume: The volume level is still anticipating the next huge move, after showing a continuous decline since October 26.
Total Market Cap: $249.2 billion
Bitcoin Market Cap: $166.8 billion
BTC Dominance Index: 66.9%
*Data by CoinGecko
Key Levels to Watch
– Support/Resistance: From below, Bitcoin is currently testing the crucial support level of $9200, along with the 200-days mentioned 200-days moving average line.
In case of a break to the downside, the next level of support is $9000, before the $8800 support area.
From above, yesterday we saw another failed tryout to breach above the $9400 – $9500 resistance area, where lies the triangle’s descending trend-line (shown on the 4-hour chart).
In case of a breakup, we should see Bitcoin reaching quickly to $9800 – $10,000 zone. Further resistance lies at $10,300 – $10,400.
BTC/USD BitStamp 4-Hour Chart
BTC/USD BitStamp 1-Day Chart
Disclaimer: Information found on CryptoPotato is those of writers quoted. It does not represent the opinions of CryptoPotato on whether to buy, sell, or hold any investments. You are advised to conduct your own research before making any investment decisions. Use provided information at your own risk. See Disclaimer for more information.
Cryptocurrency charts by TradingView.
Technical analysis tools by Coinigy.
Source: cryptopotato.com
View original post


