
Etherium Price AnalysisPrice Analysis
Ethereum Price Analysis: ETH Pulls Back To $180 But Are Bulls Plotting The Next Move Up?
Ethereum witnessed a small decline of about 2.14% over the past 24 hours and it currently trades at $182. This pullback comes after Ethereum managed to spike by 11.39% over the past week. ETH fell sharply against BTC but found support and started to travel north.
Ethereum remains the second-largest cryptocurrency with a market cap of $19.76 billion.
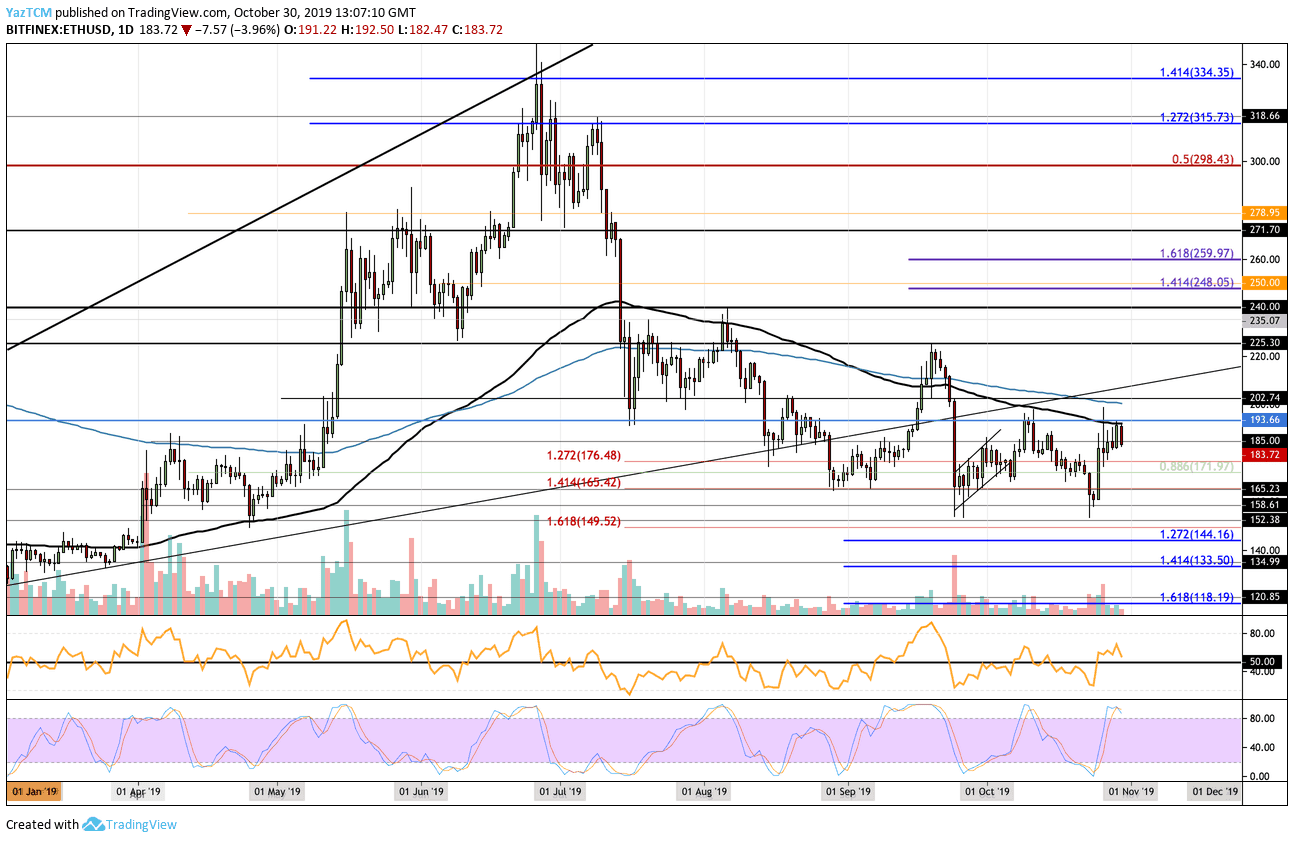
Looking at the ETH/USD 1-day chart:
- Since our previous ETH/USD analysis, the cryptocurrency managed to rebound at the support at $152 and started to climb higher. The coin continued to ascend, meeting the current resistance at $194 which is provided by a 100-days EMA.
- From above: The nearest level of resistance lies directly at $194. Above this, resistance is found at $200 which is bolstered by the 200-days EMA. Higher resistance can be expected at $210, $225 (September 2019 high), $235, and $240.
- From below: The nearest level of support lies at $182. Beneath this, support sits at $180, $176.48, $171.97, $165, and $152.
- The trading volume has started to diminish slightly but remains strong.
- The RSI has dipped and is heading toward the 50 level which shows that the bullish pressure may be fading. Furthermore, the Stocahstic RSI should warn traders to remain cautious as it is poised for a bearish crossover signal.
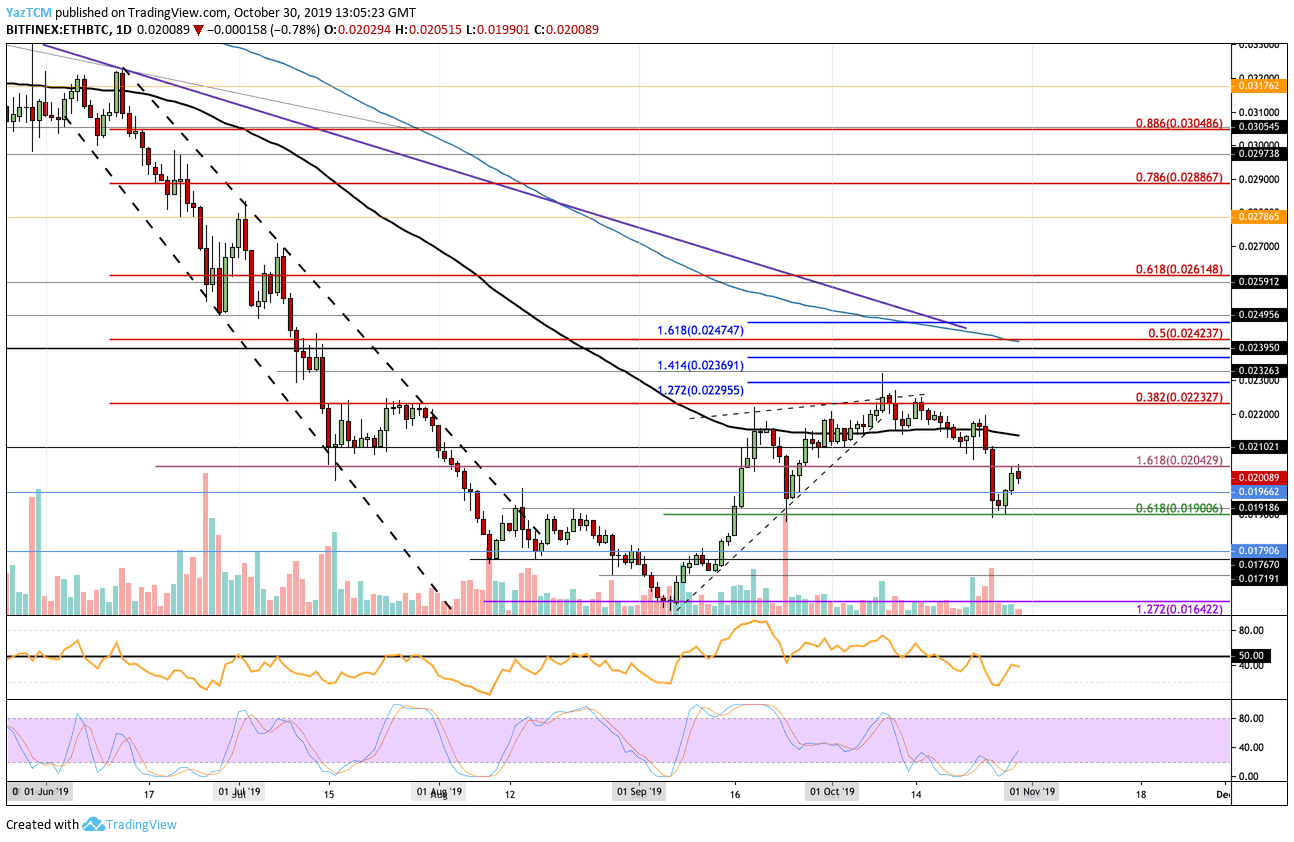
Looking at the ETH/BTC 1-day chart:
- Against BTC, ETH fell below the support at 0.0021 BTC and continued to drop until finding support at the .618 Fibonacci Retracement level at 0.019 BTC. After reaching this spot, ETH rebounded and is currently trading at 0.02 BTC.
- From above: The nearest level of resistance lies at 0.0204 BTC. Above this, higher resistance is at 0.021 BTC, 0.0215 BTC, and 0.022 BTC. Further resistance is found at 0.02232 BTC (.382 Fib Retracement), 0.02295 BTC, and 0.02369 BTC.
- From below: The nearest level of support lies at 0.02 BTC. Beneath this, support is located at 0.01966 BTC and 0.019 BTC (.618 Fib Retracement). Further support can be expected at 0.018 BTC, 0.0179 BTC, and 0.0176 BTC.
- The RSI has dipped beneath the 50 level indicating that the sellers are in control over the market momentum. However, the Stochastic RSI is primed for a bullish crossover signal which could result in ETH climbing higher against BTC.
Click here to start trading on BitMEX exchange and receive 10% discount on fees for 6 months.
The views and opinions expressed above are solely those of the author and do not reflect those of CryptoPotato. You should conduct your own research before making any decision. Every investment involves serious risk.
Cryptocurrency charts by TradingView.
Technical analysis tools by Coinigy.
Source: cryptopotato.com
View original post


