Bitcoin’s Sideways Action Set To End In $9000 or $7200? BTC Price Analysis
Two days ago, following our bullish divergence pointed out on our previous Bitcoin price analysis, we saw Bitcoin’s massive and impressive $600 move from the September low at $7700 to near the top of the short-term price range ($8400).
Since then, the coin had corrected back to its currently trading price area of $8200.
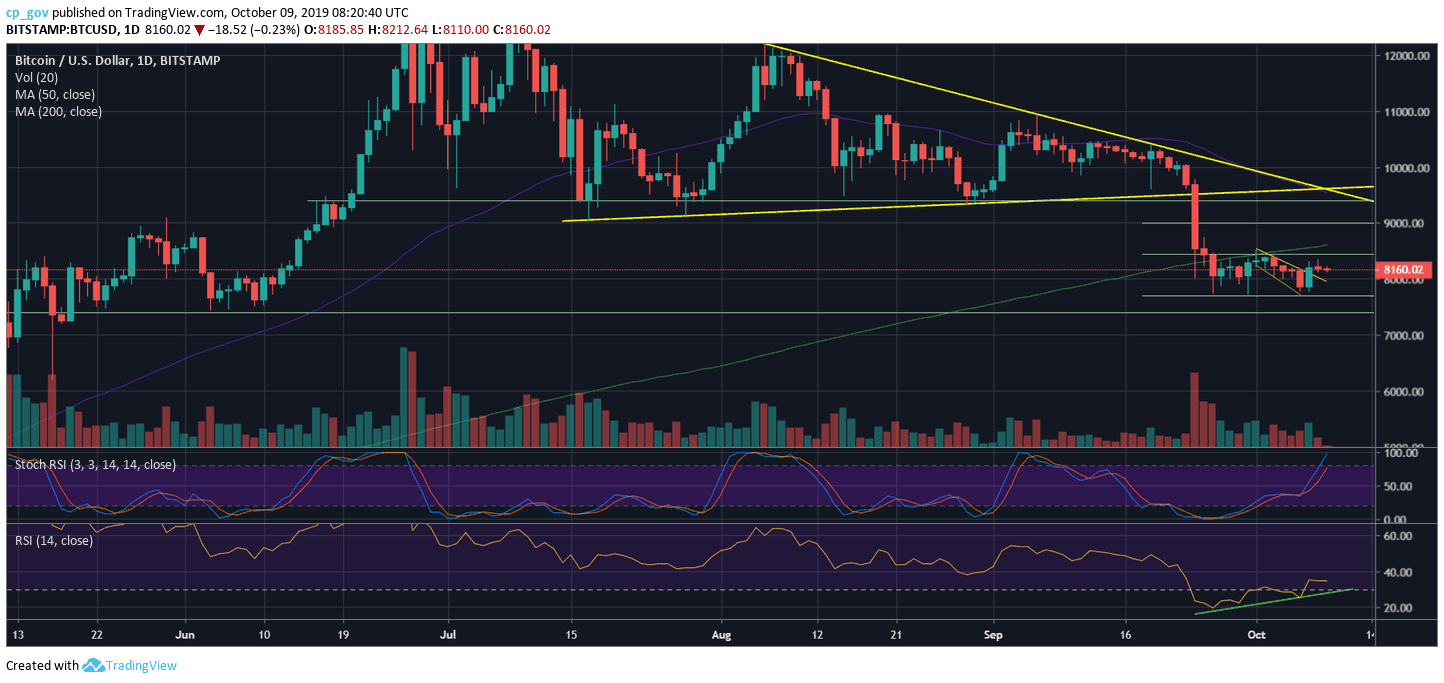
On the following daily chart, we can identify the past 14-days tight range of sideways action between $7700 and $8400. Being said that, Bitcoin should come to a decision soon. However, if the bulls want to lead the market, then they better look at the 200-days moving average line (marked light green), which is currently around $8600.
Some Relief For The Altcoins
During this sideways’ action period, the altcoins are so-far the ultimate winners. The Bitcoin Dominance keeps on declining since reaching its 2-year high of 71.5%, as the majority of the altcoins see nice gains in favor of their Bitcoin value.
Total Market Cap: $223 billion
Bitcoin Market Cap: $148 billion
BTC Dominance Index: 66.3%
*Data by CoinGecko
Key Levels to Watch
– Support/Resistance:
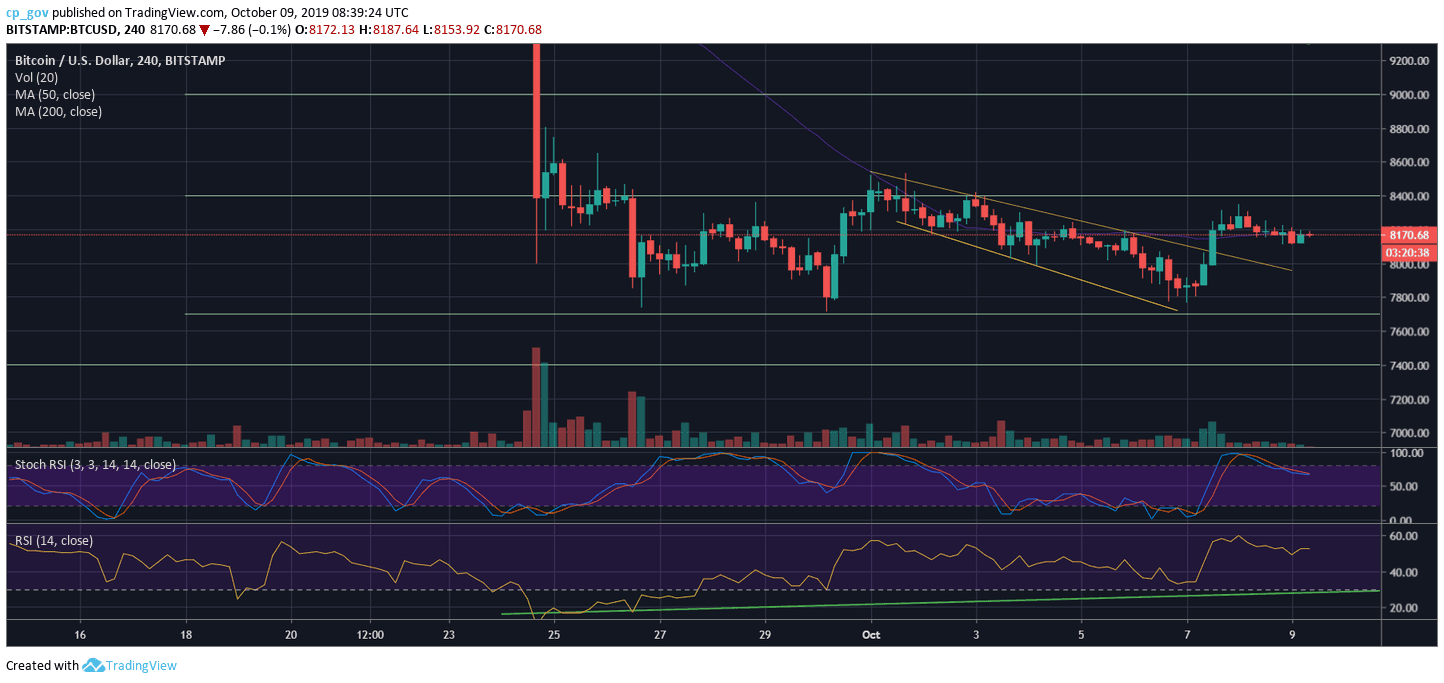
Following the nice surge from two days ago, Bitcoin is now trading around $8200, which is roughly the 50-moving average of the 4-hour chart.
The first level of support is the $8000 level, whereas further below is $7,900 (the descending trend-line intersection) and $7,700, which is the bottom of the range. Over the past two weeks, Bitcoin encountered the bottom three times and three times found support. It’s hard to believe that a fourth visit won’t lead to a breakdown of the range.
In case of a breakdown, then $7500 is the next support, whereas the $7200 could be a possible target. This level contains a historic Golden Fibonacci retracement level (61.8%) from Bitcoin’s all-time high.
From above, maintaining the $8K level could send Bitcoin to retest old support turned resistance levels at the top of the range – $8400. Further above is the significant 200-days moving average line (marked light green on the following daily chart), which currently lies around $8590. Above lies $8800, before the $9000 range and $9400.
– The RSI Indicator (Daily): The bullish divergence we had spoken about in the recent price analysis is still in place. This indicating of a quiet but bullish accumulation of Bitcoin. Since its bottom reached on September 26, the RSI is slowly rising, despite the price being kept inside the mentioned range.
– The Trading Volume: An average amount of volume followed the recent green price action so far, not enough forces for the bulls, at the ‘comeback’s day two days ago. If the bulls plan on controlling the market, the buyers’ volume levels must be a lot more impressive.
BTC/USD BitStamp 4-Hour Chart
BTC/USD BitStamp 1-Day Chart
Source: cryptopotato.com
View original post


