Bitcoin Plunges (Again) Below $8,000: New Lows Or a Clue That Might Turn BTC Bullish?
The past days had been boring for the crypto traders, whereas the price of
Bitcoin is ‘stuck’ between a tight range of $8,000 to $8,400.
However, Bitcoin just plunged below $8K one more time, marking $7920 as the current daily low (Bitstamp). What does it
mean? Is Bitcoin finally leaving the significant $8K support area searching for
new lows?
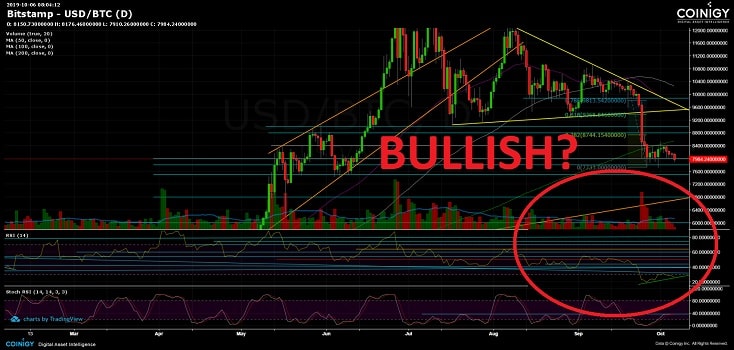
By looking at the declining daily volume candles, together with the steady but stable recent
Bitcoin price action, we can assume that a stronger move will be coming up shortly.
In my opinion, any breakout at the broader
range of $8400 from above and $7700 from below, will signal the direction of
Bitcoin’s next major move.
Divergence in RSI might turn bullish
Another thing to note is the bullish
divergence in the daily RSI. While the price of Bitcoin is moving down, a
slight positive ascending uptrend of higher lows is spotted in the RSI, the momentum indicator. This kind of
divergence might turn to be a bullish sign, that indicates on quiet
accumulation. To my opinion, till Bitcoin breaks up the 200-days moving average
line, it will be hard to see the bulls back in the market.
Total Market Cap: $216 billion
Bitcoin
Market Cap: $144.7 billion
BTC
Dominance Index: 67.0%
*Data
by CoinGecko
Key Levels to Watch
– Support/Resistance:
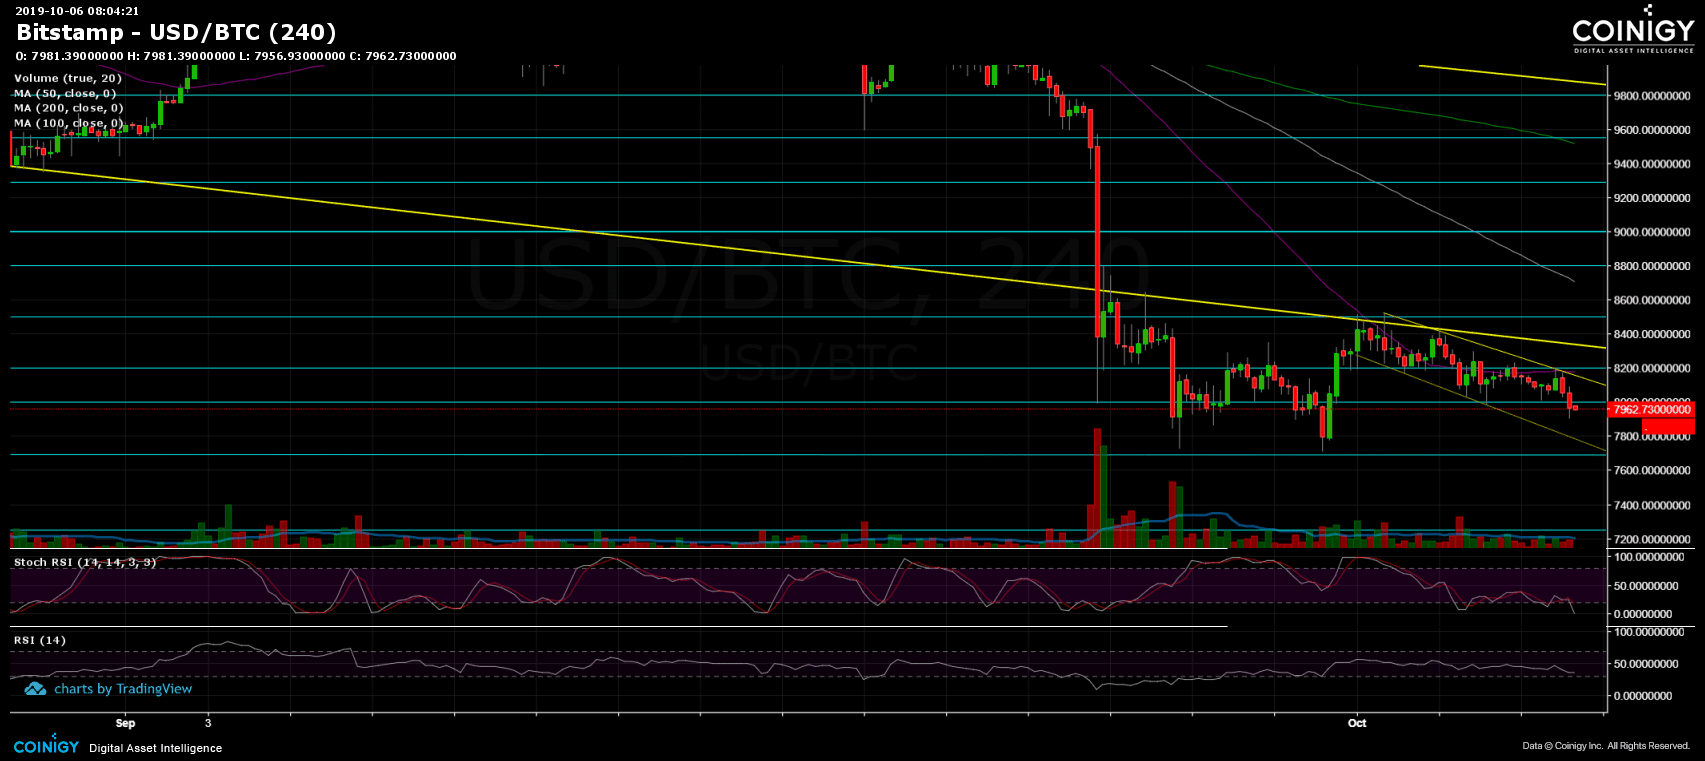
As of writing this, Bitcoin is struggling
to maintain the $8000 support level. If Bitcoin fails to do so, then the next
support levels are likely to be $7,900 and $7,700 along with the lower
descending trend-line of the marked price channel on the 4-hour chart. $7700 is
also the lowest price of Bitcoin since the parabolic move to $13,880 (2019 high).
So far, $7,700 has held twice; can it hold for the third time?
In case of a breakdown, then $7500 is the next support, whereas the $7200 could
be a possible target. This level contains a
historic Golden Fibonacci retracement level (61.8%) from Bitcoin’s
all-time high.
From above, maintaining the $8K level,
could send Bitcoin to retest old support turned resistance levels at $8200 (the
4-hour MA-50 marked in purple) and $8400. Further above is the significant 200-days
moving average line (marked light green on the following daily chart), which currently lies around $8550.
– The RSI Indicator (Daily): Discussed above.
– The Trading Volume: Discussed above.
BTC/USD BitStamp 4-Hour Chart
BTC/USD BitStamp 1-Day Chart

Source: cryptopotato.com
View original post


