
Bitcoin Massive Dump Is Here: Those Are The Next Possible Targets For BTC Price (Analysis & Overview)
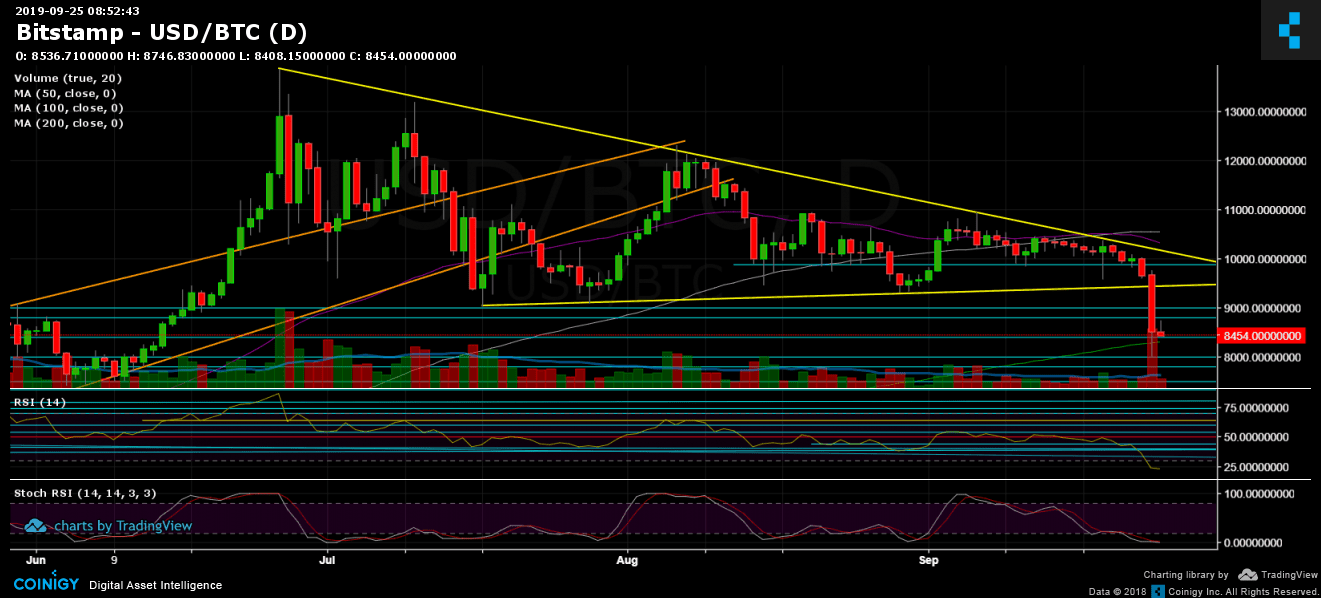
Just yesterday we had warned from a Bitcoin price dump coming, as the coin was getting very close to the bottom line of the symmetrical triangle. Another warning sign came from the mini Death Cross between the 50 and the 100-days moving average lines, seen on the following daily chart.
Those who don’t believe in technical analysis can’t ignore the fact that a triangle pattern was built since June, and for almost five months, we saw the triangle providing support and resistance for Bitcoin. Once Bitcoin broke out of the pattern, which took place 12 hours ago, Bitcoin saw a massive plunge of almost $1,500 in a matter of minutes.
Ok, so what now?
First, we could expect this kind of violence following a 3x in Bitcoin’s price in a matter of four months. No asset which goes parabolic can continue without parabolic moves to the other side, which is the downside in this case.
Another thing to note is that finally, the CME gap got filled (the price gap between $8900 and $8500). Those price gaps are common in the conservative stock markets trading, because trading is not 24/7. In crypto, gaps became possible only in markets such as the CME and CBOE since the trading hours are just like any other stock exchange (Monday to Friday). As evidence, once Bitcoin lost support around $9000, the bears filled the gap immediately down to $8500.
Is this the end of Bitcoin? Are we going back to $6,000 and $3,000 (the bottom from 2018)? Very early to say, but it’s possible that the bearish action isn’t done yet.
The breakdown of the triangle hands a scary target around the $6,000 area. Does it have to play out? Not for sure. There are some possible support areas until there.
Total Market Cap: $217 billion
Bitcoin Market Cap: $150 billion
BTC Dominance Index: 68.9%
*Data by CoinGecko
Key Levels to Watch
– Support/Resistance:
Following the vast, colossal breakdown, Bitcoin found temp support upon the $8300 level, mentioned in yesterday’s price analysis. That level contains the significant 200-days moving average line (marked light green on the daily chart). That level had been kept in the daily close; however, today is a new day and a new candle.
Further below is the $8000 support, which was the lowest point Bitcoin reached yesterday. Below is $7600 and $7200. The last is the Fibonacci level of 61.8% since reaching the 2019 high last June.
The closest resistance is now located in the support turned resistance area of $8500 – $8600 and further above at $9000 and $9400. To get back to the bullish track, there must be a move back to the triangle area above $9400 (and not test and get rejected).
– The RSI Indicator (Daily): November 2017, 2018, is the last day the RSI had seen such a low when Bitcoin was nearing its 2018 low at $3500. The indicator is way oversold at around 22-23, of course, in the bearish territory. There might be a positive correction from here. However, there is also space to move to the downside.
– The Trading Volume: As expected, the breakdown was followed by a massive amount of volume. The daily volume candle hadn’t seen such amount since the middle of July. The action is finally back around Bitcoin.
BTC/USD BitStamp 4-Hour Chart

BTC/USD BitStamp 1-Day Chart
Source: cryptopotato.com
View original post


