
Bitcoin Price Analysis: Volume Declining Despite Bakkt, Mega-Dump Coming?
Over the past two days, we had seen Bitcoin slowly melting down, marking the $9600 support as its current daily low.
Bakkt futures launch, as expected, was more like a “sell on the news event.” So far, the volume there is very minimal, also when compared to the CME launch day, back in December 2017. Despite that, the CME futures gained volume over time, and this could also be the case with Bakkt.
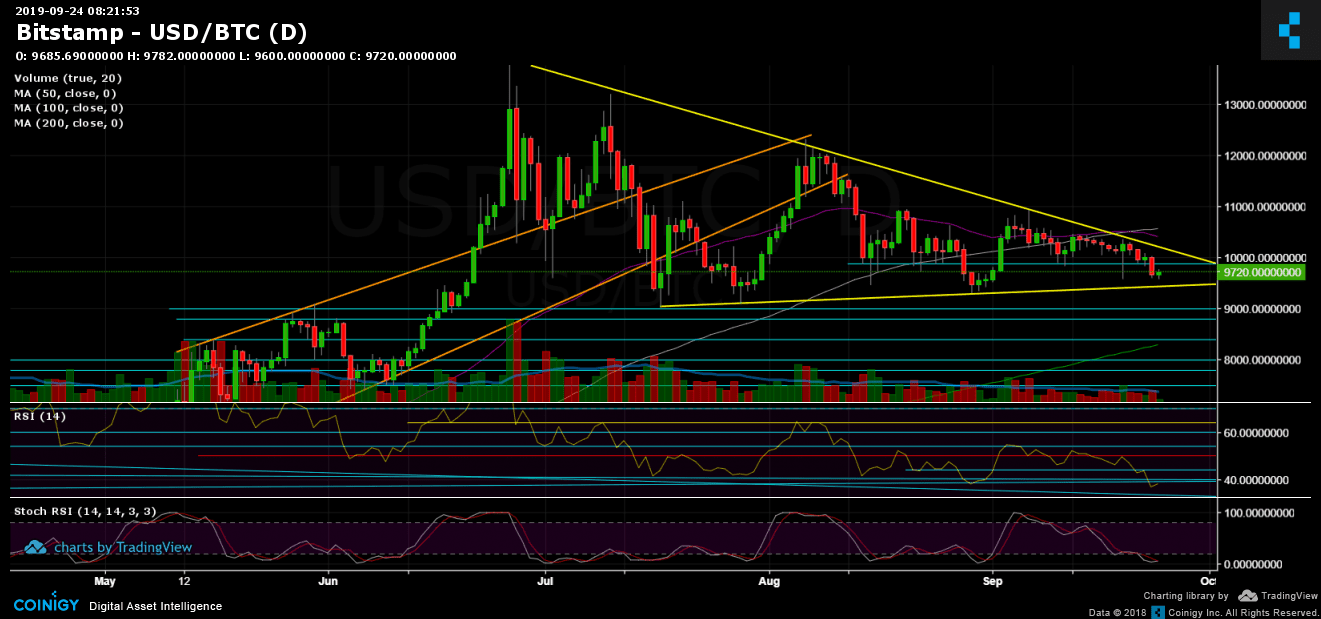
As could be seen on the following daily chart, the bigger picture is still the same: a giant symmetrical triangle which had started forming since June. The triangle’s apex is found somewhere in the first days of October, but usually, these kinds of formations don’t like to wait till the apex to breakout.
As we stated three days ago while Bitcoin was above $10,000, the short term is bearish, and until further clue, it looks like it’s still the forecast. However, Bitcoin is getting very close to the triangle’s lower boundary around $9,400. This could turn into a mega-dump in case of a breakdown.
Another sign for bearishness is the cross of the 50-days moving average line (purple) below the 100-days moving average line (white). Yet, not a death cross, but a bearish sign for the short-term.
From the other side, Bitcoin had seen massive sell-off over the past days, and there might be a positive correction to retest $10,000, but this time as resistance.
To sum it up – the longer term is dependent on the triangle pattern – breaking above $10,500 (along with the significant 50 and 100 days moving average lines) or the bearish forecast which will take place when breaking down $9,400 or the lower boundary.
Total Market Cap: $256.7 billion
Bitcoin Market Cap: $175.7 billion
BTC Dominance Index: 68.4%
*Data by CoinGecko
Key Levels to Watch
– Support/Resistance:
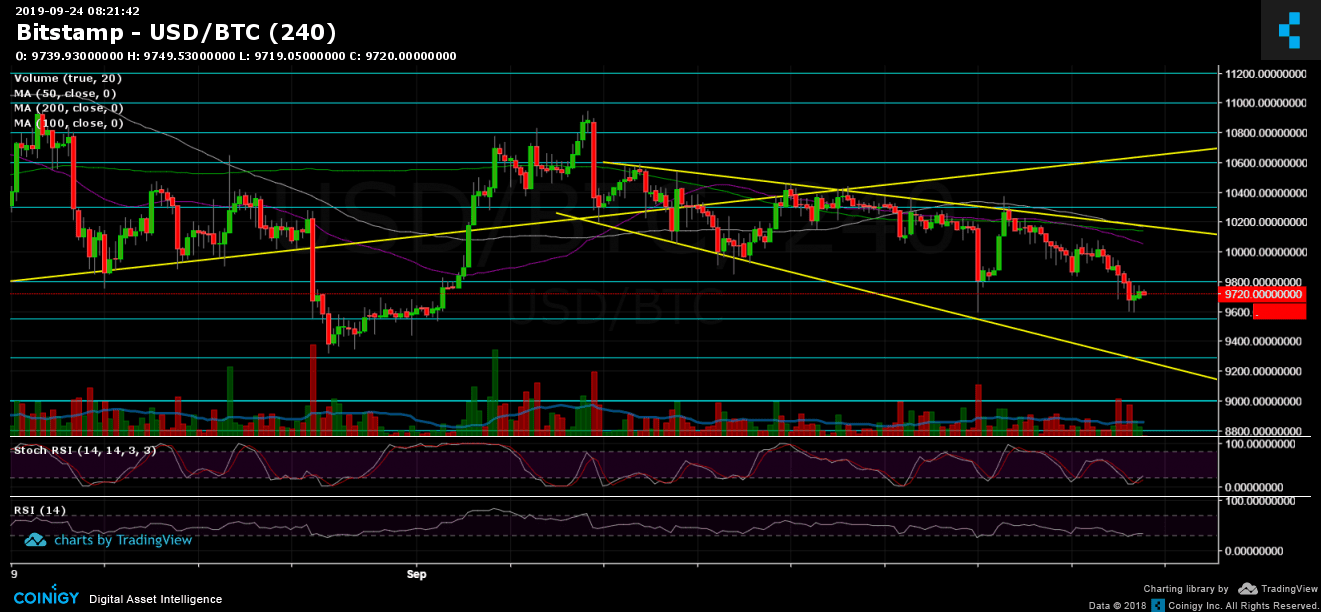
After breaking down both the significant $10,000 and $9,800 support areas, and finding support on top of the next level at $9,600, Bitcoin is now facing the $9,800 from below, as resistance.
A break above and likely to see the correction reaching the $10,000 one more time. Further above are all the support turned resistance levels, including the descending trend-line of the triangle currently around $10,200 – $10,300. Next, there is the MA-50 at around $10,430 and MA-100 presently around $10,580.
From below, the next support level is $9,600 before reaching the bottom line of the triangle around $9,450. In case of a breakdown, we can expect a massive move to the downside: Possible targets are support levels at $9,000, $8,800, $8,500 (CME futures’ gap) and $8,300 (the significant 200-days moving average line).
– The RSI Indicator (Daily): The RSI just marked its lowest point since February this year. As of now, it’s facing the 40 resistance, but a new lower low in RSI is not a bullish sign. Despite that, Stochastic RSI is at the oversold territory, and we could see some positive correction in the short-term.
– The Trading Volume: The huge move is not here yet, the volume is still very low. Overall, the volume keeps on declining since the end of June.
BTC/USD BitStamp 4-Hour Chart
BTC/USD BitStamp 1-Day Chart
Source: cryptopotato.com
View original post


