
Bitcoin Price Analysis: The Breakout Is Imminent – BTC Price To Surge or Plunge (Very Soon)
As been written on the previous price analysis, Bitcoin’s trading range is getting tighter and tighter. The king of cryptocurrencies is not used for trading with such low volatility.
As can be seen on the following two time-frames – the daily chart and the 4-hour chart – Bitcoin is getting very close to the apex of its decision point for the short and the longer-term.
Whether the next move will be bullish or bearish – it’s too early to state. There are reasons for both directions.
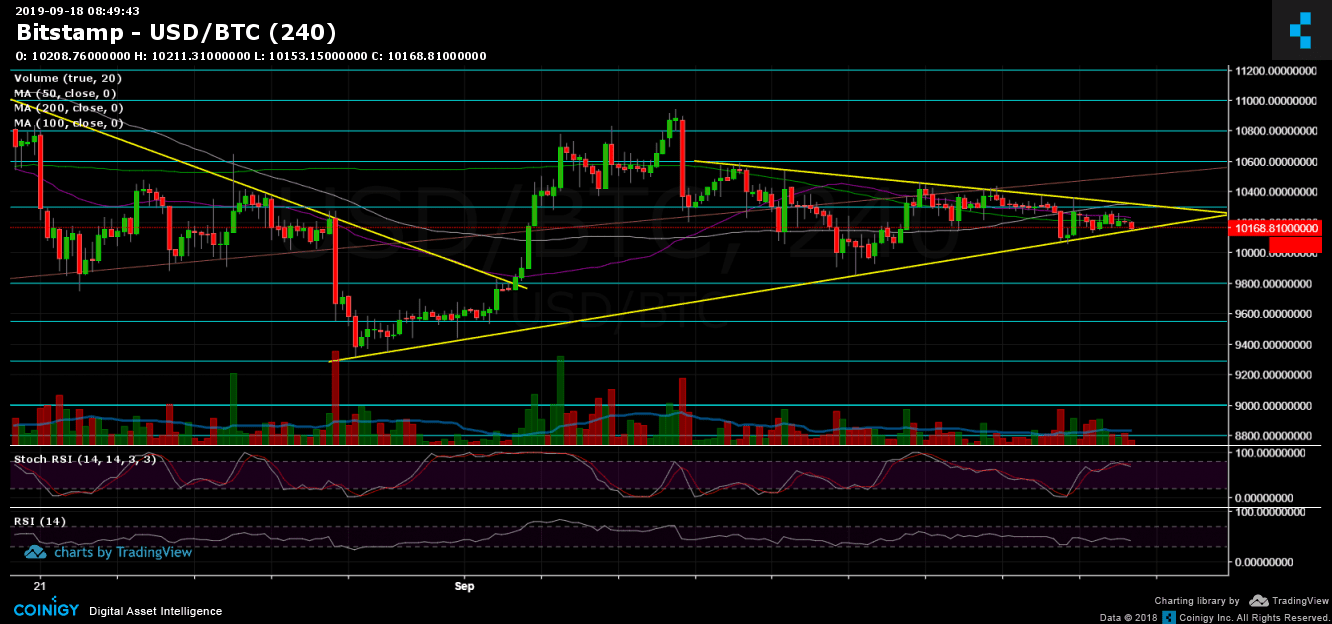
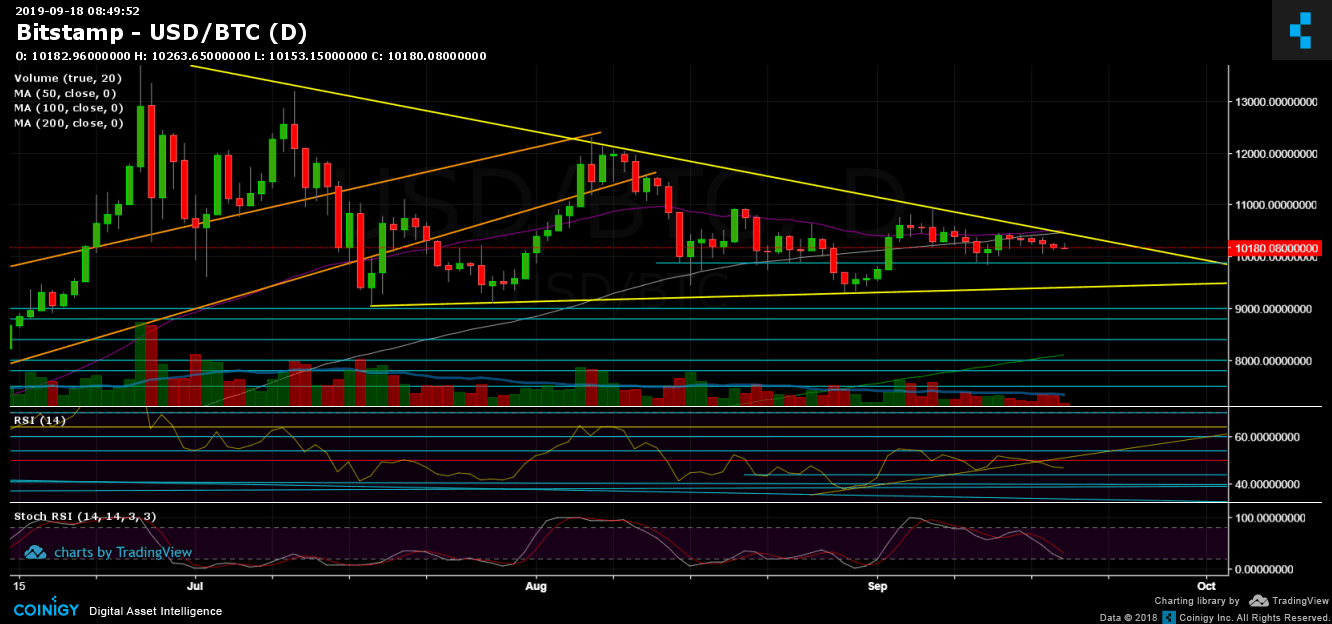
There are actually two major price decisions: The 4-hour chart reflects a symmetrical triangle, the “small” triangle, whereas its apex is expected in the next day or two. The bigger picture is the daily chart, and there, the triangle (the “big” triangle) suggests a massive move around the next 1-2 weeks. This triangle consists of resistance around $10,400 – $10,500 along with the 50 and 100 days moving average lines, whereas support lies around $9,400.
A breakout of the small triangle might give clues of the direction the big triangle is likely to break to.
Altcoin Season? Hmmm
One word about the altcoins: I’ve seen many YouTubers and Twitter influencers keep on saying that “Altcoins are dead” and “Bitcoin dominance will soon be 80% or above”. Whoever been here for more than one market cycle, would know that this time there is no difference – the altcoins have their role in the crypto trading environment, and the big whales would give up on them so quickly. Hence, no surprise to see them surging over the past two days. Altcoin season? Too early to say, there are still decades away from their tops.
Total Market Cap: $272 billion
Bitcoin Market Cap: $183 billion
BTC Dominance Index: 67.6%
*Data by CoinGecko
Key Levels to Watch
– Support/Resistance:
Bitcoin is still around the supply-demand confluence area of $10,200 – $10,400. This area also contains the two major moving average lines: The 50-days (marked purple) and the 100-days (marked white on the daily chart).
In case of a bullish breakout of the triangle mentioned above and moving average lines (~$10,500), we can expect the next immediate target to be $10,800. Further above is the $11,000 resistance level. The last is the last high from the daily chart. If Bitcoin plans on the bullish side, $11,000 might become support rather than resistance.
From the bearish side, a breakdown of $10,200 (the current price area) will send Bitcoin to retest $10,000 again. Further below is $9,880 and $9600 before the significant supporting trend-line at $9400.
Another thing to watch for is a bearish cross of the 50-days MA (purple on the daily chart) below the 100-days MA. The two lines almost correspond; however, they are very close to each other. The next days will decide whether a cross-over will take place or not.
– The RSI Indicator (Daily): The RSI is losing momentum, below the 50 bullish area. However, still trading above the 44-45, which is the last low from September 10. If the bulls want to continue higher – very important to maintain above the previous level.
– The Trading Volume: As been said here over the last analysis, the volume is decreasing over time, and getting ready for a price breakout to either side.
BTC/USD BitStamp 4-Hour Chart
BTC/USD BitStamp 1-Day Chart
Source: cryptopotato.com
View original post


