
The Calm Before The Storm? Bitcoin Is Ready For Its Next Big Move – Very Soon (BTC Price Analysis)
Over the past three days, and since our previous price analysis, we had seen Bitcoin almost steady, waving between $10,200 to $10,400.
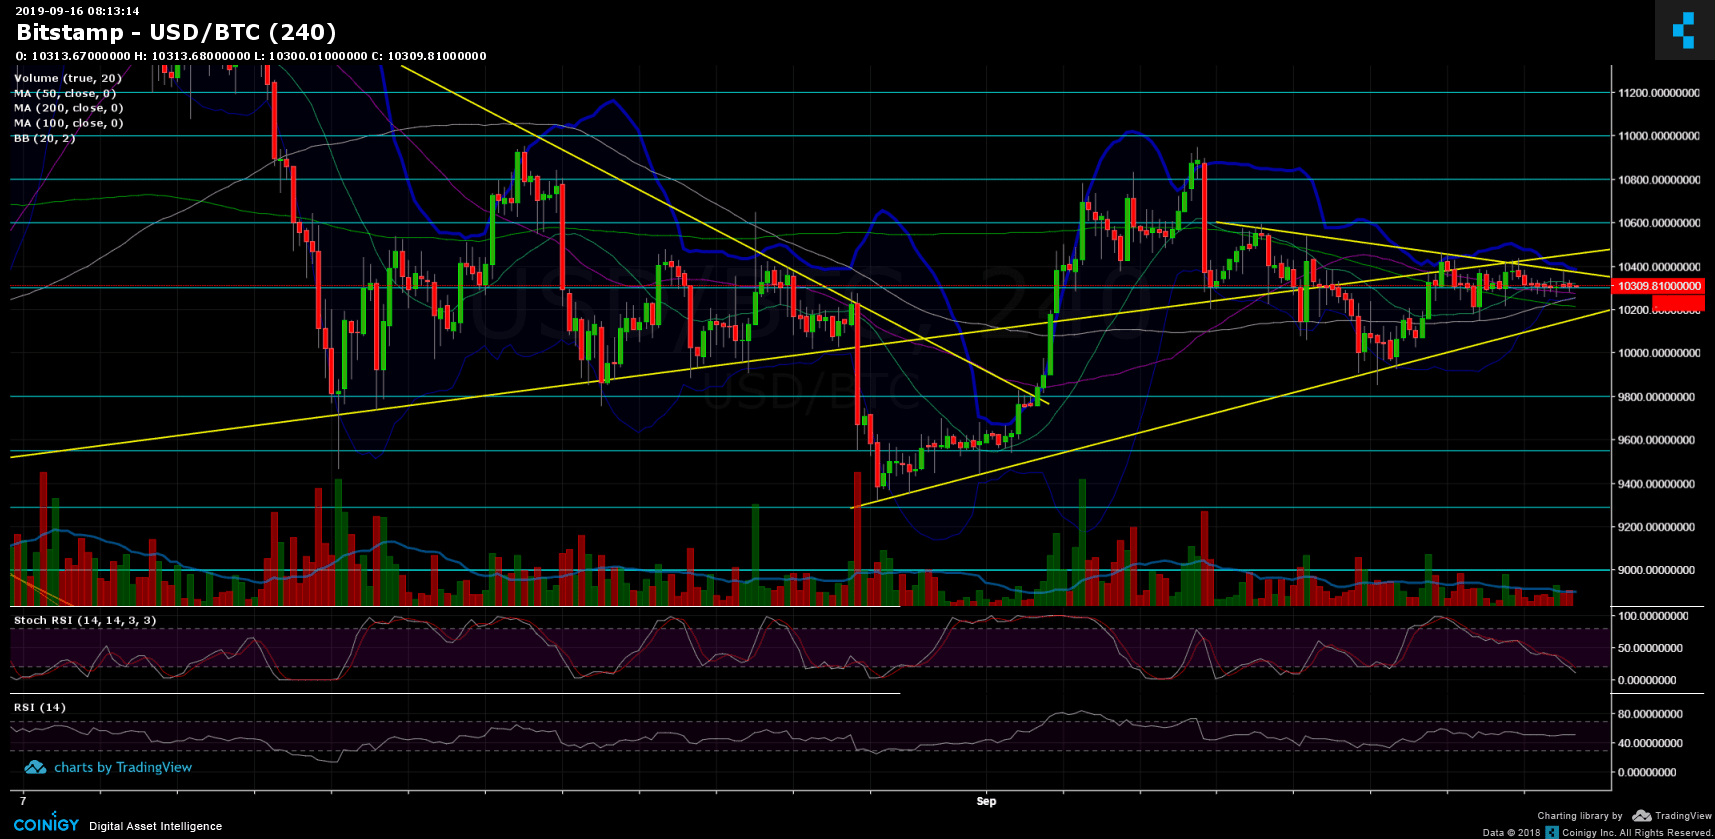
A triple-day turnover of only about $200 (roughly 2%) is rare in the recent Bitcoin’s history. Looking at the Bollinger Bands (marked with blue on the following 4-hour chart), they are at their closest level since September 1st. When This kind of setting takes place, it indicates that a sharp price move is likely coming up. In the last time the bands shrunk that way, it turned out to be the surge from $9400 to $10,700 in just over a day. Is Bitcoin planning another bullish surprise?
More than that, looking on the volume metrics from the top crypto exchanges, we can see that the daily volume candles are decreasing over time. This also indicates a coming up sharp move.
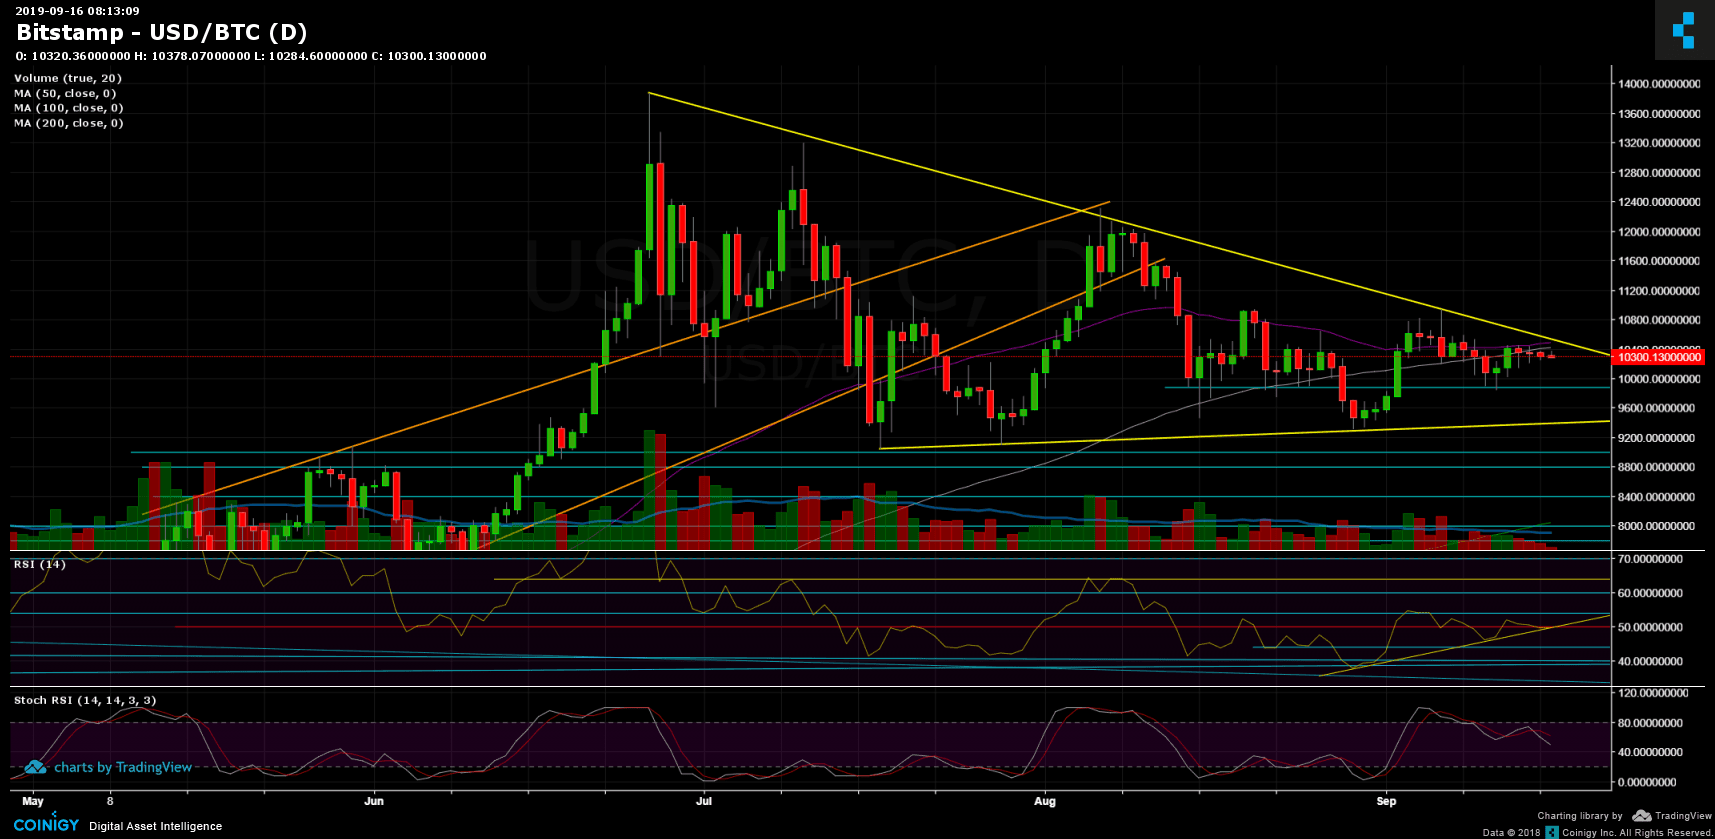
Looking on the RSI indicator on the following daily chart, we can see that it’s right upon reaching a mid-term ascending trend-line support. Either way, this is another decision point, getting ready for a price move on top of the 50 indecisive area.
A new week is starting today, perfect for the heavy traders to get back to work.
Total Market Cap: $267 billion
Bitcoin Market Cap: $185 billion
BTC Dominance Index: 69.4%
*Data by CoinGecko
Key Levels to Watch
– Support/Resistance:
Continue to the stated above, Bitcoin is still in the supply-demand confluence area of $10,200 – $10,400. This area also contains the two major moving average lines: The 50-days and the 100-days.
Looking on the 4-hour chart, we can see a triangle forming – resistance at $10,400, support at $10,200. This also tells about the tightening boundaries of where the price is currently trading at.
In case of a bullish breakout of the above-mentioned moving average lines (~$10,480), we can expect the next immediate target to be $10,600. Further above is $10,800 and the $11,000 region. The last is the last high from the daily chart. If Bitcoin plans on the bullish side, $11,000 might become support rather than resistance.
From the bearish side, a breakdown of $10,200 will send Bitcoin to retest $10,000 again. Further below is $9,880 and $9600 before the significant supporting trend-line at $9400.
Another thing to watch for is a bearish cross of the 50-days MA (purple on the daily chart) below the 100-days MA. The two lines almost correspond; however, they are very close to each other. The next days will decide whether a cross-over will take place or not.
BTC/USD BitStamp 4-Hour Chart
BTC/USD BitStamp 1-Day Chart
Source: cryptopotato.com
View original post


