
Bitcoin Price Analysis: Another Attempt To Break The Crucial Resistance Line – Will This End-Up In $11,000 Or $9,000 For BTC?
Two days ago, while Bitcoin was attempting to stay above the critical $10,000 mark, we have pointed out two scenarios in the bigger picture:
“The bigger picture from below is the crucial support line around $9,400, which is the last barrier before the triangle breaks to the downside. From the top, the triangles’ trend-line sits around the resistance level of $10,300 – $10,400.”, as taken from the previous Bitcoin price analysis.
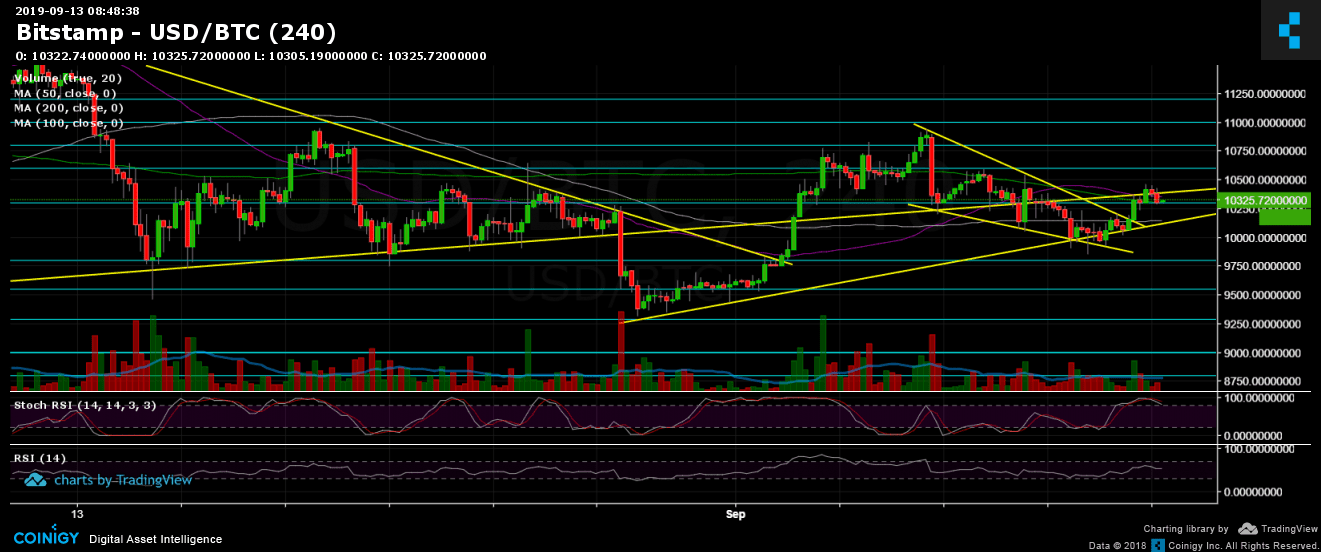
As you could see, the wedge shown on the 4-hour chart had been breached to the bullish side, what ignited the later scenario out of the two, whereas Bitcoin reached the area of resistance at $10,300 – $10,400. The area which Bitcoin is currently trading at.
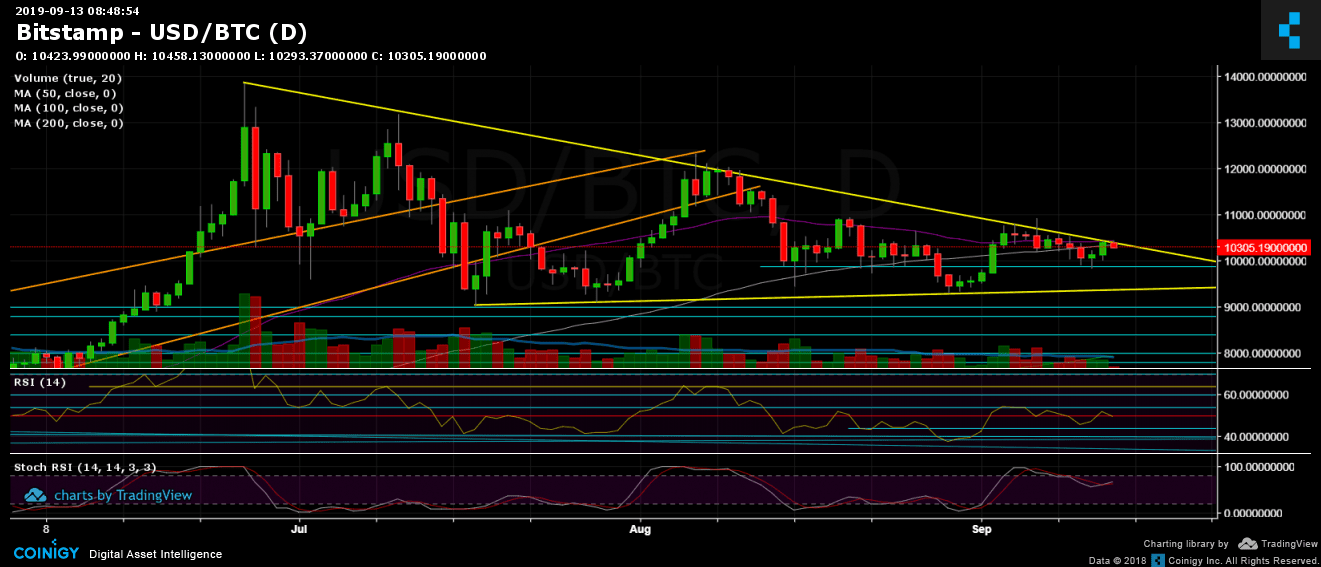
This area consists of a lot of supply that might be a decision point for Bitcoin: the 50-days (purple) and the 100-days (white) moving average lines, along with the significant descending trend-line – marked in yellow on the following daily chart. That line was started forming when Bitcoin recorded its 2019 high of $13,880 last June.
Can Bitcoin overcome this, in what could send the coin to a decent rally? Will it be another roof before another plunge towards $10K and $9,400? Some near-future events, such as Bakkt’s futures launch, can be the triggers for such huge moves. Keep in mind that the Bitcoin dominance is only upon a decision point – at the 70% mark.
Total Market Cap: $264 billion
Bitcoin Market Cap: $185 billion
BTC Dominance Index: 70.3%
*Data by CoinGecko
Key Levels to Watch
– Support/Resistance:
As mentioned above, Bitcoin is facing the critical support area of $10,300 – $10,400. In case of a breakout, this is likely to lead a decent price move. The next resistance levels are $10,600, $10,800 and $11,000. The last is the latest daily high. The last time Bitcoin opted for breaking it, turned out to be a plunge of quick $700.
From below, the nearest area of support is the ascending trend-line marked on the 4-hour chart (around $10,200 as of now), followed by the famous $10,000 level. Further down is the $9,880 support along with the 4-hour’s chart ascending trend-line. Further below lies $9600 (weak support level), before the crucial $9,400 level (the bottom yellow ascending trend-line, the bottom line of the triangle). If broken down, Bitcoin is likely to produce a quick move down to $8,800 – $9,000 at first.
– Daily chart’s RSI: Following another failed tryout to break above the 54-55 level, the RSI is now facing the significant 50 level. Overall, there’s a bit of bullish divergence in the RSI, but for this to be considered, the indicator needs to overcome 55.
– Trading Volume: Like mentioned previously, not a massive amount of volume is following the recent price action. Adding to the above, the daily volume is decreasing over time; this might tell on a coming-up more significant price move.
BTC/USD BitStamp 4-Hour Chart
BTC/USD BitStamp 1-Day Chart
Source: cryptopotato.com
View original post


