
Cryptocurrency Market Analisys: Market Uncertainty, But Altcoins Affairs Are Going Backward

The altcoin market keeps declining Moreover, technical analysis of Ethereum and Ripple XRP indicates strong sellers pressure.
Meanwhile, Bitcoin remains “squeezed” as part of the formation of the Triangle model. On the one hand, this is a sign of uncertainty, on the other hand – a signal in the direction of increasing volatility and the beginning of pattern development. The potential for the development of the bullish momentum remains, while buyers manage to keep the price above the level of $ 9100. The breakdown of this area will provoke a strong correction with targets below $ 7175. A strong signal confirming the development of growth in BTC/USD will be a breakdown of the upper boundary of the Triangle model.
Note, Litecoin looks very weak right now, which does not demonstrate high-quality bounces up amid the Bitcoin growth.
Bitcoin
The leading digital asset keeps moving within the Triangle model. At the same time, quotes once again repel from the area between moving averages, which indicates pressure from buyers. Here, the support level of $ 9100 remained unbroken.
All these factors can talk about the potential for upward movement with the breakdown of the upper boundary of the Triangle model, which, in turn, will indicate the continued development of the bullish trend. An additional signal in favor of the rise is the breakdown of the downward trend line on the RSI indicator, which predicts the breakdown of a similar line on the price chart at the upper boundary of the model. A confirmation will be consolidation above the level of $ 12,445.
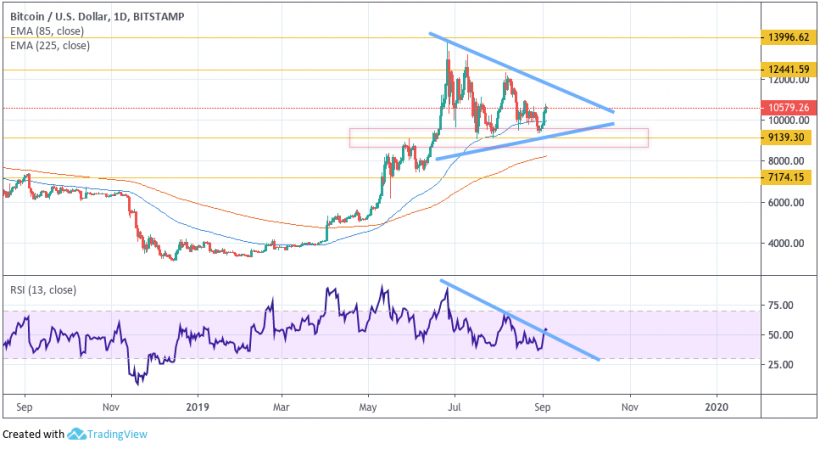
The reversal of the option is another wave of decline and consolidation of asset quotes under the level of $ 9100. The immediate goal is the area of $ 7175 in this case.
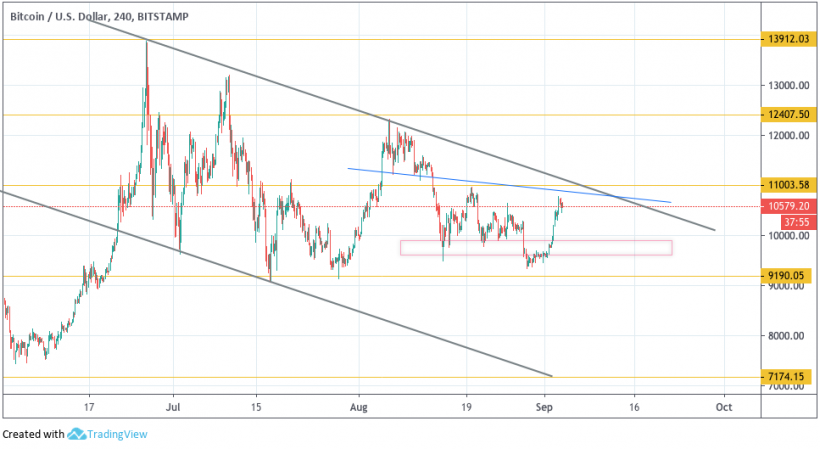
Cryptocurrency keeps moving in the framework of the downward channel. At the moment, there is potential for the formation of an inverted “Head and shoulders” model. The area for completing the formation of the right “Shoulder” of the model is located at the level of $ 9300, from where we can expect the beginning of the upward movement.
The purpose of model development is the area at the level of $ 12,405. A reversal of the rise is a breakdown of the upper border of the downward channel and fixing quotes above $ 11,000. If the price falls under $ 9190, it can fall to $ 7175.
Ethereum
ETH/USD is still decreasing in anticipation of the completion of the formation of the bullish Wolfe Wave pattern. As you can see, the support area is located near the level of $ 145. There we can expect the development of an upward movement.
Another strong signal in favor of a short-term fall is the breakdown of the lower boundary of the ascending channel, the test of which is now taking place after the breakdown. In favor of the likely reversal and the beginning of the upward movement. A rebound from the support line on the RSI will come out. Confirmation of growth will be a breakdown of the resistance level and consolidation above $ 197, which will indicate a turn to the upward channel.
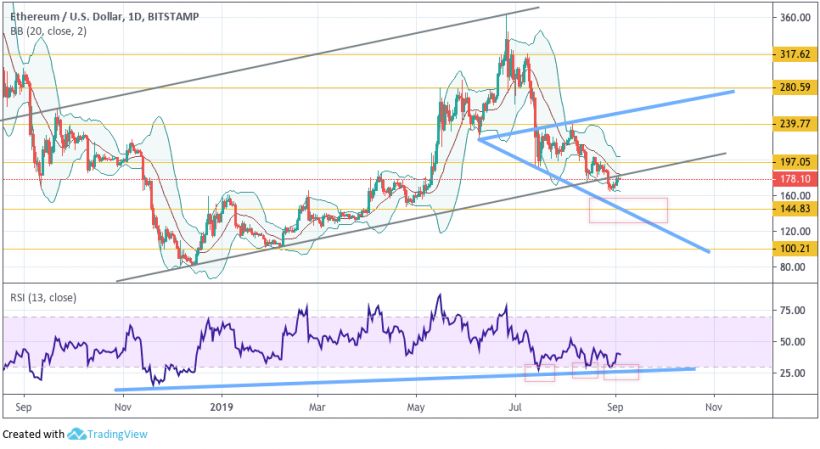
The cancellation of the positive option is a breakdown of the level of $ 120. Then we should expect the continued decline to the first target at $ 100. Here point acknowledge Max Keyser, who indicated on his Twitter ETH goals at $ 90.
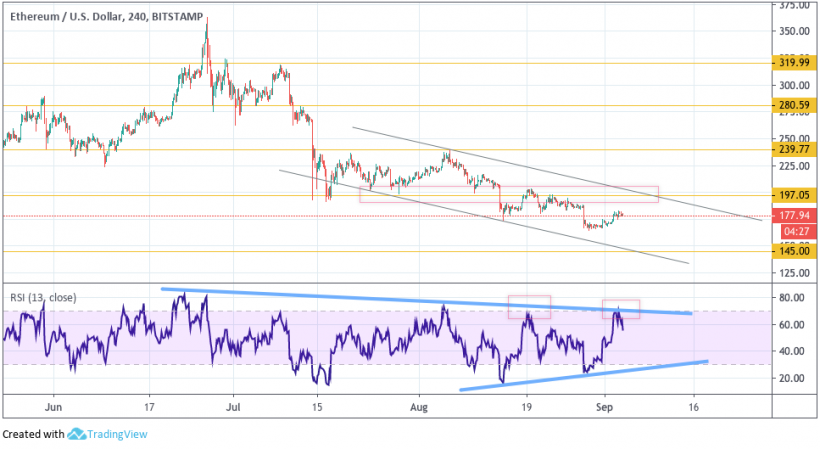
A technical analysis of the 4-hour chart also indicates a continued decline. In favor of this option is a rebound from the resistance line on the RSI indicator. The nearest support on the RSI is lower, so you should expect a test level of $ 145, only after which it is possible to start moving up. Cancellation of the reduction option will be a strong growth and a breakdown of the upper border of the downward channel with the fixing of ETH/USD above the level of $ 197. In this case, the growth target is the area of $ 240.
Ripple XRP
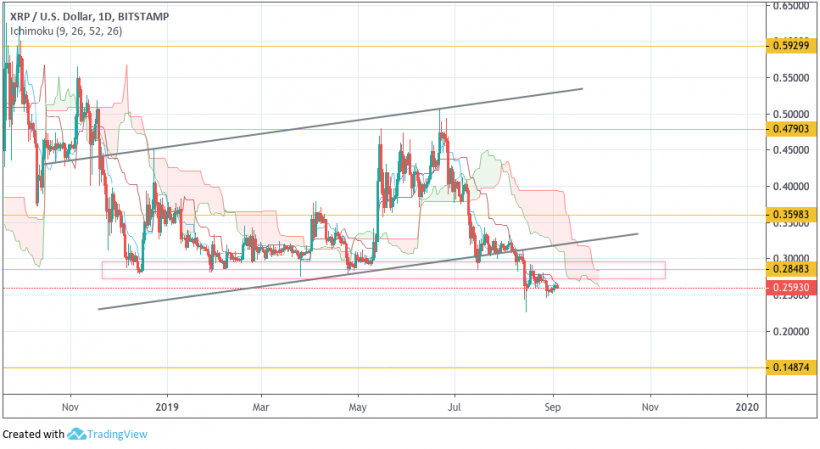
XRP/USD keeps moving under the Ichimoku Kinko Hyo Indicator Cloud, indicating a bearish trend. Here we observe constant bounces from the signal lines of the indicator. Pressure from sellers is present. A breakdown of the lower boundary of the lateral corridor has taken place and the potential for continued decline with a potential target of $ 0.1485 remains. Cancellation of the option with a decrease will be a strong growth and a breakdown of the upper boundary of the Indicator Cloud with quotes fixing above the level of $ 0.3250.
The 4-hour chart indicates a potential continuation of the fall to the target at $ 0.1485. A rebound from the resistance level took place, which suggests a further fall. In favor of this option, another test of the trend line on the RSI indicator also appears. A past test of this line sent the price further down. The reversal of the negative scenario for the cryptocurrency is a breakdown of the level of $ 0.3085, which will indicate a way out of the downward channel and the continuation of the rise with the first target at the level of $ 0.3600.

Litecoin
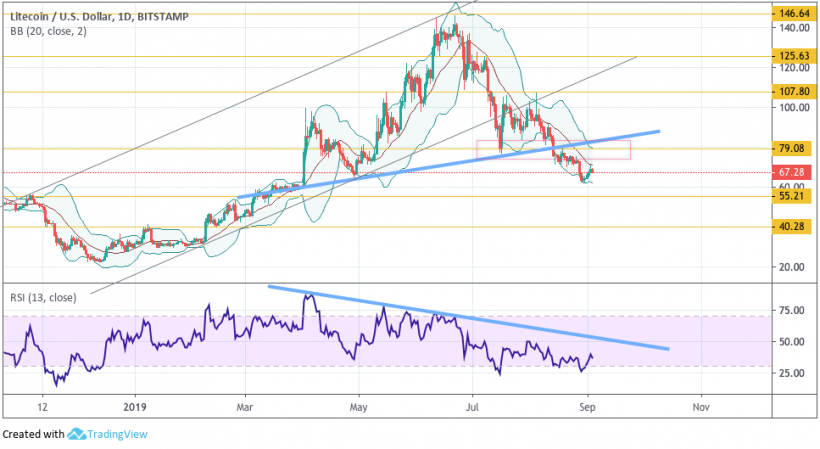
LTC/USD remains under the “Neck” line of the “Head and Shoulders” reversal pattern. The potential for continued fall is maintained. The asset continues to build on the midline of the Bollinger Bands indicator, indicating strong pressure from sellers. As the main trading idea, we should expect a test of the resistance level of $ 79.00 and continued movement down to a potential target at $ 40.25. An additional signal in favor of this option will be a rebound from the resistance line on the RSI indicator. Cancellation of the reduction scenario will be a breakdown of the upper boundary of the Bollinger Bands indicator, which will demonstrate the potential for a change in trend in favor of the upward one.
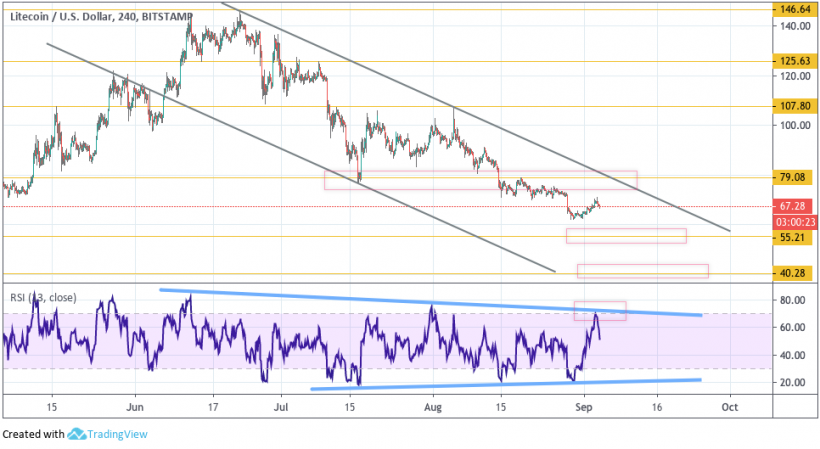
On the 4-hour chart, the downward momentum continues to develop within the descending channel. Expect continued development of the downward impulse to the first target at the level of $ 55.00. A strong signal in favor of falling is the rebound from the trend line on the RSI indicator. The reversal of the negative option is a strong growth and a breakdown of the upper border of the downward channel with the fixing of LTC/USD above the level of $ 79.00.
Bitcoin Cash
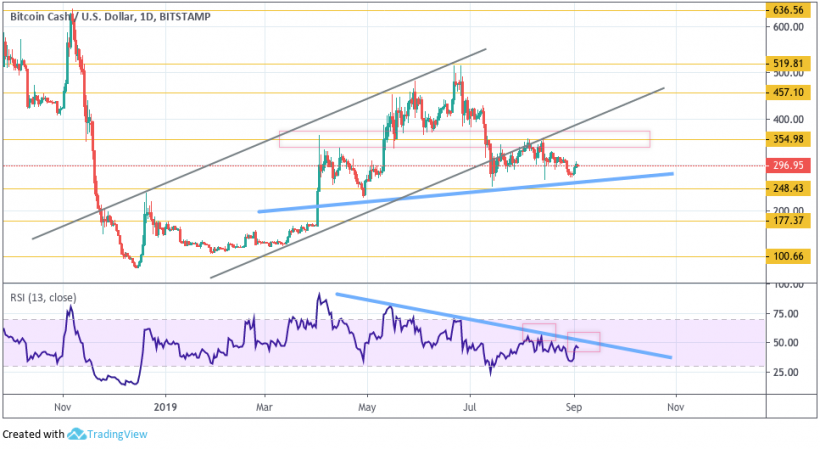
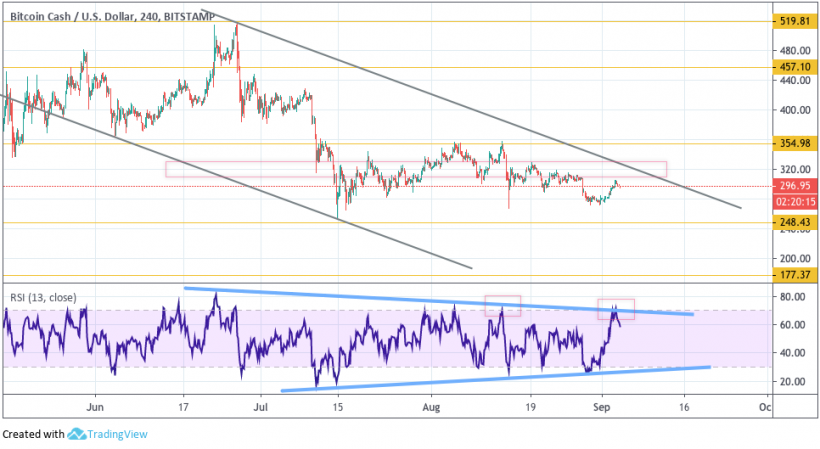
Bitcoin Cash keeps moving as part of the formation of the head and shoulders reversal pattern. However, the breakdown of the Neck line has not yet taken place. In favor of continuing the decline and the beginning of the development of the reversal model, a rebound from the resistance line on the RSI indicator will be made. Confirmation of the fall in cryptocurrency will be a breakdown of the support level and consolidation at $ 248.45. Cancellation of the negative option is strong growth with a breakdown of the resistance level and consolidation above $ 355.00. These events will cause the reversal of the formation of the reversal model and the continuation of the rise to the first target at the level of $ 457.10.
BCH/USD is moving within the downward channel. We should expect a test of the upper border of the channel near the level of $ 320.00, and then continue the decline with the first target at $ 248.45. A breakdown of this level will extend the fall to the level of $ 177.35.
An additional signal in favor of this movement is the rebound from the trend line on the RSI indicator. Cancellation of this option will be a breakdown of the upper boundary of the downward channel and consolidation above the level of $ 354.98, in which case growth is expected to continue to the potential target at the level of $ 457.10.
Source: en.bit.news


