
Is Bitcoin’s Dull Price Action the Calm Before the Storm? BTC Analysis
After three days of no significant price movements, Bitcoin is now planning its next move. As we all know, Bitcoin’s volatility is never low for long, and it might currently be preparing for another move.
Although most indicators are currently bearish, Bitcoin likes to do the unexpected. The bigger picture still features a descending bearish triangle formation from the past month and a half.
Bitcoin is now trading around $9,600, and the bottom of the triangle lies at $9,000-$9,200 whereas the second descending trend line which combines the upper angle lies around $10,300-$10,400.
Hence, there is a high probability that the end of this calm will indeed see a sharp move, either to the top of the triangle at $10,300, or to the bottom of the triangle around $9,200.
Total Market Cap: $249 billion
Bitcoin Market Cap: $172 billion
BTC Dominance Index: 69.2%
*Data from CoinGecko
Key Levels to Watch
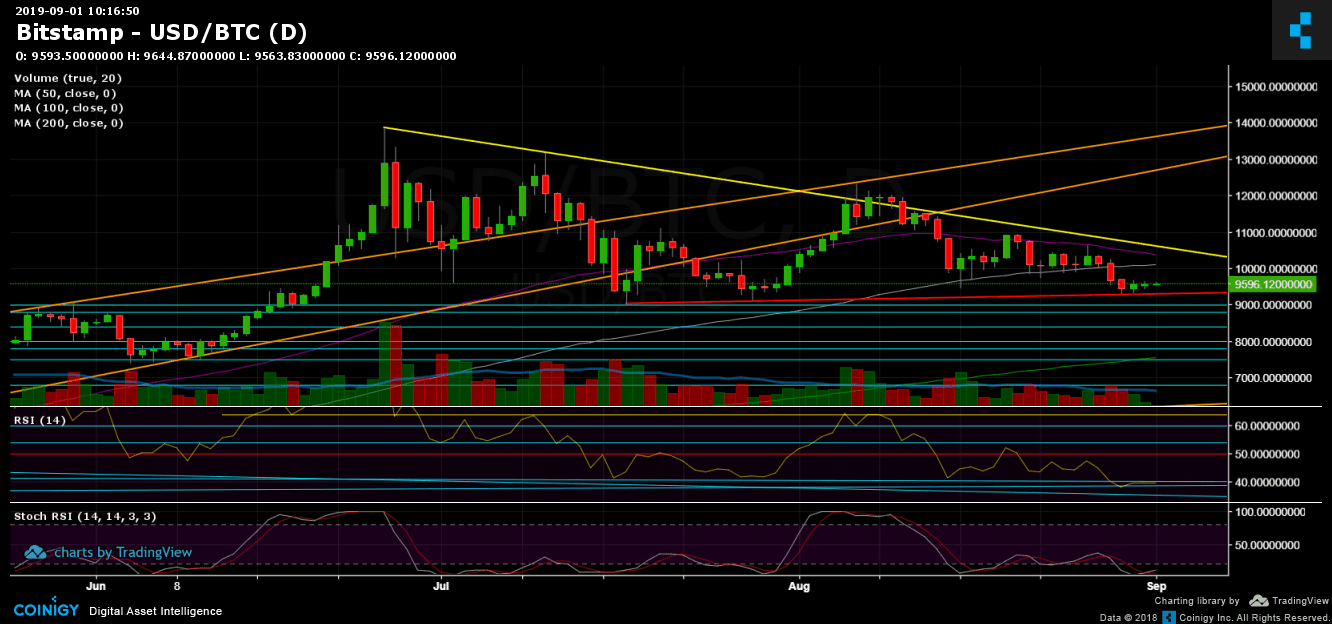
Support/Resistance: Since our previous analysis, the short-term picture hasn’t changed much with respect to support and resistance levels. Bitcoin is now trading between $9,500 and $9,600. The nearest support lies at $9,400, whereas the next significant support level is $9,200. The latter aligns with the aforementioned ascending trend line (marked in red on the daily chart), which contains the lows reached since the 2019 high. Further below are $9,000, $8,800, and $8,500 (in the short term).
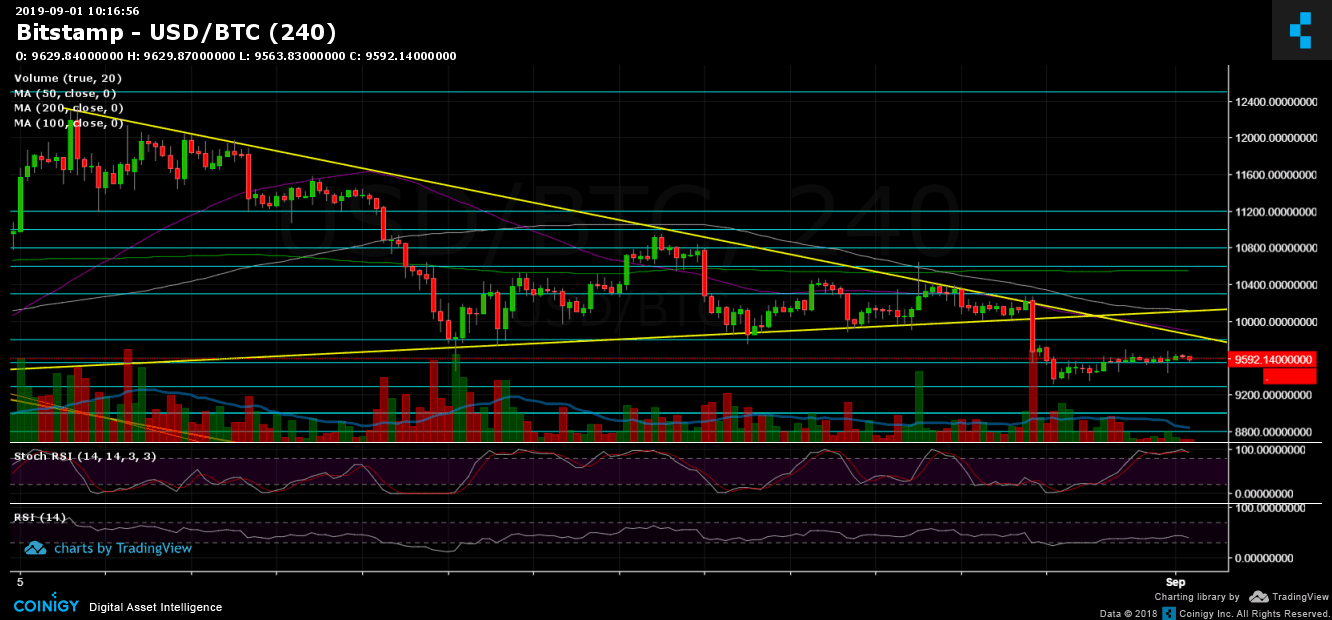
On the bullish side, the next major resistance levels are $9,700-$9,800 and $10,000 (along with the boundary of the smaller 4-hour triangle that broke down three days ago and the significant 100-day moving average line, marked in white). Further above are $10,300 and the 50-day moving average line (currently located around $10,400) which Bitcoin failed to break above last week.
Daily chart’s RSI: The RSI is the lowest it has been since February. Currently, the RSI is doing battle with 40. The Stochastic RSI oscillator is showing signs of a possible correction following a crossover in the oversold area. However, it still has yet to enter bullish territory.
Trading Volume: The past three days have seen almost no trading volume, and the previous two weeks saw a low amount of volume. This is why a sharp price move is anticipated.
BTC/USD Bitstamp 4-Hour Chart
BTC/USD Bitstamp 1-Day Chart
Source: cryptopotato.com
View original post


