
Bitcoin Breaking Down Below $10,000 – Here Are Some Options For a Possible Bottom (BTC Price Analysis)
Every time Bitcoin is trading under tight range, together with a decreasing amount of volume, there will be a huge price move coming up shortly after.
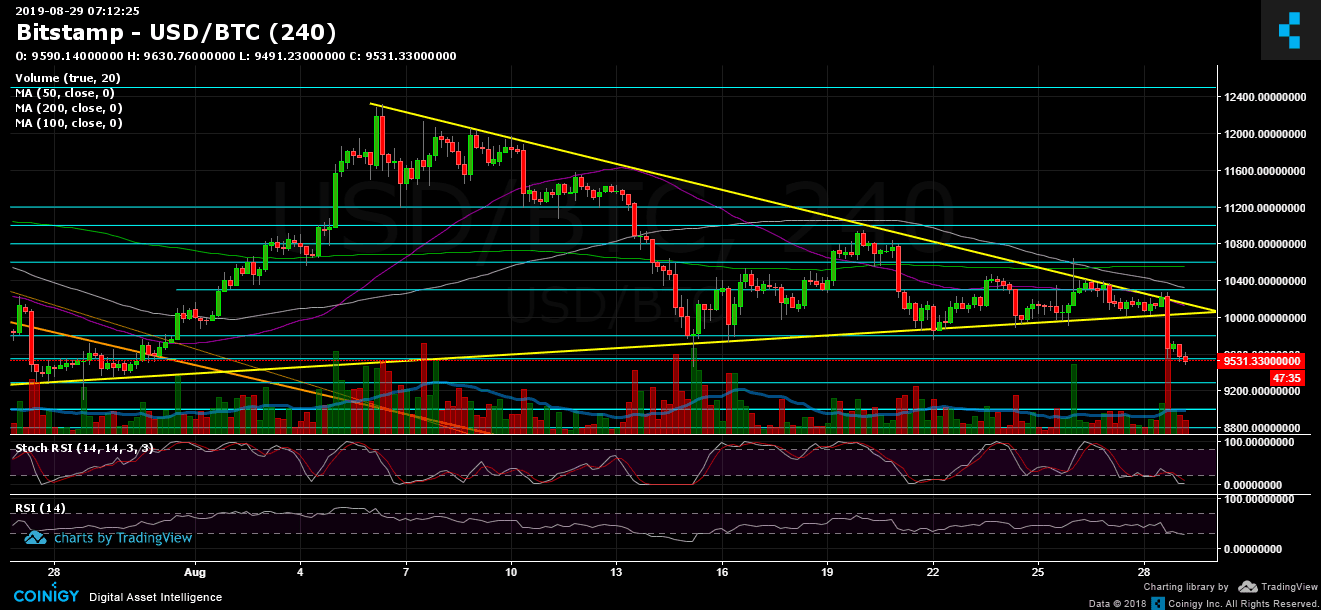
During the previous month, we have mentioned the 4-hour triangle formation developing and that we were expecting the breakout (either direction) to take place very soon since the apex of the triangle is nearby. Despite that triangles usually ‘pop’ to either side shortly before reaching the actual apex and tend not to wait till the exact apex.
During the recent hours, Bitcoin saw a large ugly red candle of roughly $700, breaking down to mark the current levels as the daily low.
Looking on the altcoins, we see pretty much the same picture: they are reaching for even lower prices against Bitcoin while Bitcoin drops or surges. It seems like the only settings allowing the altcoins to gain are when Bitcoin’s price is stable.
Lowest RSI Since February 2019
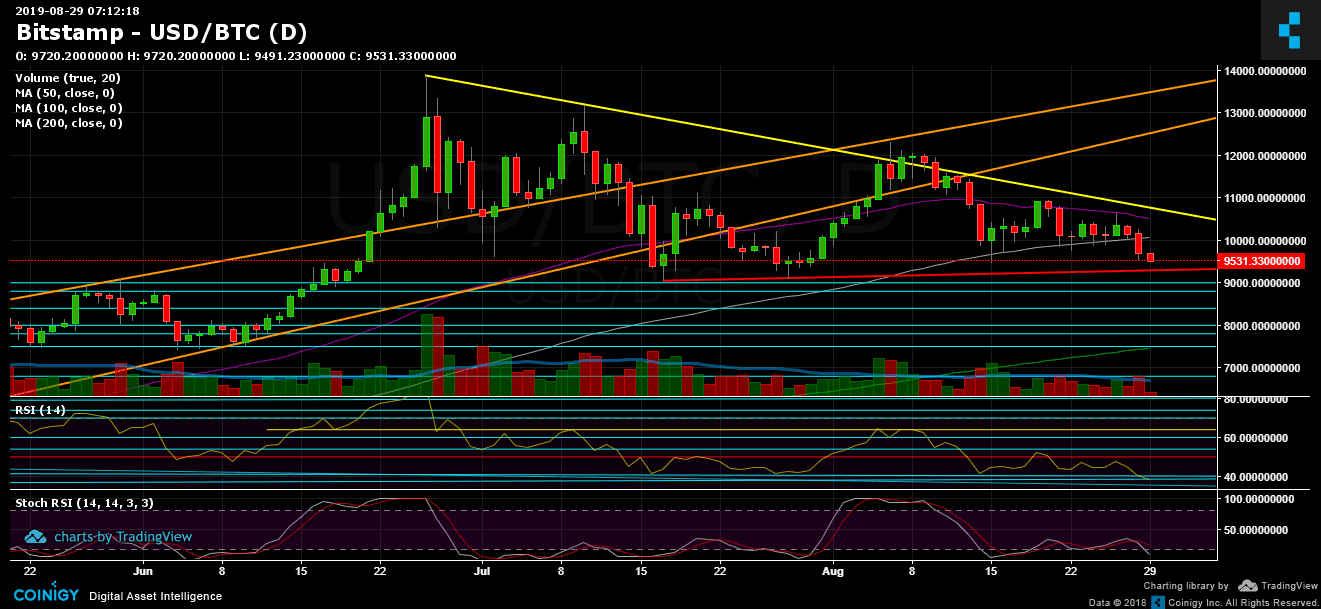
The momentum indicator, the RSI, is showing weakness and is pretty much bearish. After failing to succeed in creating a higher low on the daily chart, the RSI plunged severely to the 38 level.
This is its lowest value since February 7, 2019 (almost seven months). The positive insight is that the Stochastic RSI is deep down in the oversold area, so a temp correction might be coming soon, along with reaching to a possible support area ($9400 – $9500). However, until proved otherwise, the bears are back.
Total Market Cap: $248 billion
Bitcoin Market Cap: $171 billion
BTC Dominance Index: 69.1%
*Data by CoinGecko
Key Levels to Watch
– Support/Resistance:
After the triangle got broken down, and as expected, Bitcoin produced a massive move to the downside – quickly breaking down the support area at $9800 – $10,000, reaching the next support at $9400 – $9500. In the likely case of a breakdown, the next significant support level is the $9200, where lies the ascending trendline (marked red on the daily chart), which contains the lows since reaching 2019 high and coming down. Further below lies $9000, $8800, and $8500 (levels for the short term).
From the bullish side, if indeed a correction coming up it will likely send Bitcoin to the support turned resistance levels at $9800 and $10,000 (along with the triangle’s boundary that broke down and the significant 100-days moving average line – marked white). Further above are $10,300 and the 50-days moving average line (around $10,500), which Bitcoin had failed to break-up early this week.
– Daily chart’s RSI: discussed above.
– Trading Volume: Yesterday’s huge drop was the highest volume day during the past week. However, it’s not even close to the average daily volume during June. It will be interesting to see if the bears are selling in high volumes and if they are controlling the market from this aspect as well.
BTC/USD BitStamp 4-Hour Chart
BTC/USD BitStamp 1-Day Chart
Source: cryptopotato.com
View original post


