
Bitcoin Aims to Break Down the Supporting Triangle Formation and $10K: Huge Plunge Coming? BTC Price Analysis
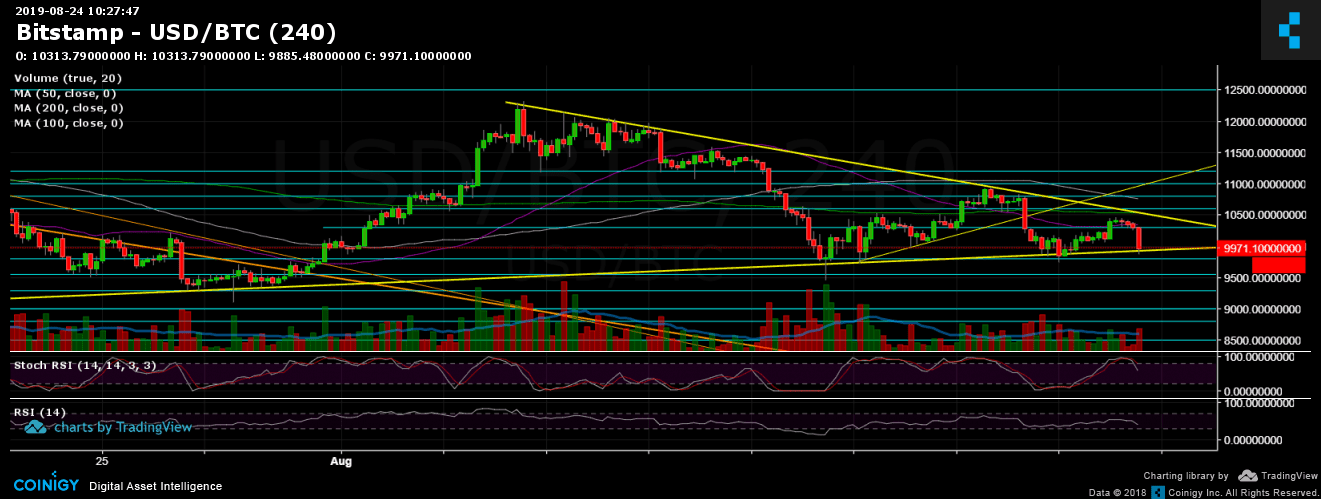
Over the past ten days, we have seen Bitcoin trading inside a very tight price range between ~$9400 and ~$10,800 (which contains the 50-day moving average line, marked in purple on the chart below).
This range is also forming a horizontal triangle pattern whose apex is rapidly nearing, seemingly mere days away. However, usually this type of structure doesn’t ‘wait’ until it reaches the apex, so the breakout could take place at any moment.
In recent hours, the Bitcoin price has declined by approximately $400, approaching the lower boundary of the triangle pattern along with the $10,000 support area.
Can Bitcoin hold one more time? So far, this level has been supported seven times. As we know, the more times a support is tested, the higher the chances are of a breakdown.
Despite Bitcoin’s consolidation, some altcoins are showing strength, which is reminiscent of the craziness of an altcoin season. However, despite their recent gains, the prices of the altcoins are far away from their all-time highs.
Total Market Cap: $261 billion
Bitcoin Market Cap: $179 billion
BTC Dominance Index: 68.3%
*Data from CoinGecko
Key Levels to Watch
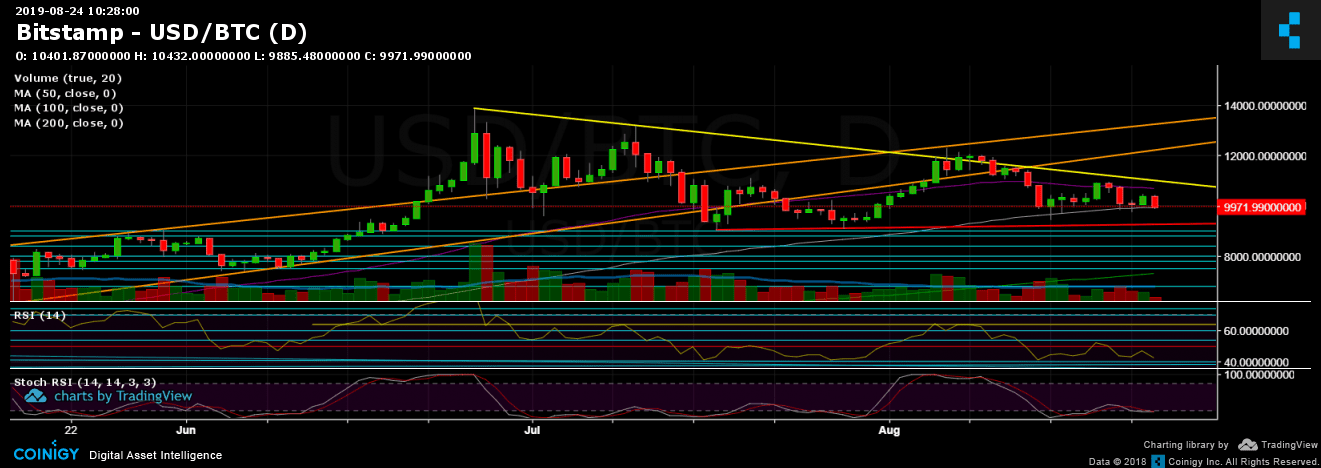
Support/Resistance: Following the recent $400 plunge, Bitcoin now faces the critical support between $9,800 and $10,000, along with the bottom boundary of aforementioned triangle. Looking at the 1-day chart, we can also see that Bitcoin is holding above the 100-day moving average line (marked in white), which lies around $9,900.
A breakdown of the triangle is likely to produce an ugly red candle to the downside; the next support levels are $9,600 (weak), $9,400, and then the $9,000-$9,200 range. Further below are $8,800 and $8,500.
From the bullish side, the next level of resistance lies at $10,300 and the triangle’s descending trend line (which is roughly $10,400). Further above is the 50-day moving average line ($10,700-$10,800), followed by the unbreakable $11,000 region.
Daily chart’s RSI: The RSI is also at a critical level; dropping from 42 would mean breaking down from the previous low, on its way to a lower low. Overall, the RSI doesn’t look very bullish, following the breakdown of the 50 level.
Trading Volume: Looking at the last three trading days (not including today), we can observe a decreasing amount of volume. This is another sign of an upcoming strong price move. Overall, the past week’s trading volume has been relatively low.
BTC/USD Bitstamp 4-Hour Chart
BTC/USD Bitstamp 1-Day Chart
Source: cryptopotato.com
View original post


