Tron (TRX) Price Analysis: Trend Remains Bearish Below $0.020
- Tron price declined heavily after it settled below the $0.0200 support against the US Dollar.
- TRX price is currently correcting higher after trading to a new monthly low at $0.0159.
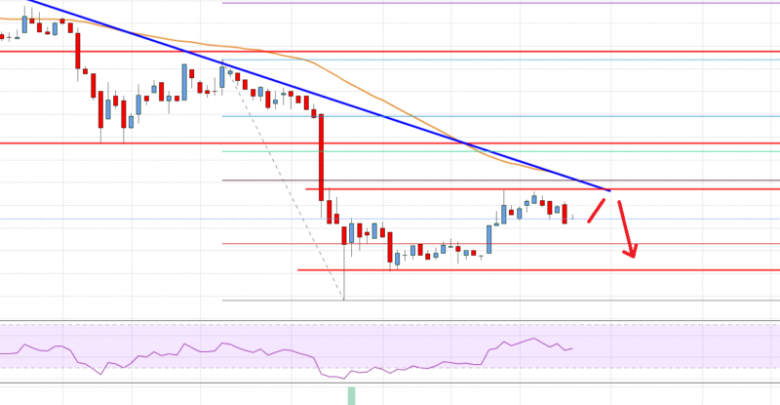
- There is a significant bearish trend line forming with resistance near $0.0184 on the 4-hours chart (data feed via Bitfinex).
- The price is likely to remain in a downtrend until it settles above the $0.0184 and $0.0200 resistances.
TRON price is trading in a major downtrend against the US Dollar and bitcoin. TRX price could only start a strong recovery once it breaks $0.0184 and gains strength above $0.0200.
Tron Price Analysis
This past week, TRON price accelerated its decline below the $0.0200 support against the US Dollar. The TRX/USD pair even broke the $0.0185 support level and settled below the 55 simple moving average (4-hours). It opened the doors for more downsides and the price tested the $0.0160 support level. A new monthly low was formed near $0.0159 and the price recently started an upside correction.
There was a break above the $0.0170 resistance plus the 23.6% Fibonacci retracement level of the last major decline from the $0.0212 high to $0.0159 low. Additionally, the price managed to pop above the $0.0180 level. However, the upward move was capped by the $0.0184 and $0.0185 resistance levels (the previous supports). The 50% Fibonacci retracement level of the last major decline from the $0.0212 high to $0.0159 low is also near $0.0185.
Moreover, there is a significant bearish trend line forming with resistance near $0.0184 on the 4-hours chart. Therefore, tron price is likely to face a strong selling interest near the $0.0184 and $0.0185 levels. The 55 simple moving average (4-hours) is also near the $0.0185 level to act as a hurdle. If there is a break above $0.0185, the price could recover towards the $0.0194 resistance.
The main resistance is near the $0.0200 level, above which the price could gain bullish momentum. Conversely, if the price fails to climb above $0.0185, there could be another bearish wave. An immediate support is near the $0.0172. The next key support is at $0.0165, below which the price might aim $0.0160.

The chart indicates that TRX price is still trading in a major downtrend below $0.0185 and $0.0200. A successful close above $0.0185 might increase the chances of more upsides. However, a clear break above $0.0200 is needed to decrease the current bearish pressure.
Technical Indicators
4 hours MACD – The MACD for TRX/USD is losing momentum in the bullish zone.
4 hours RSI – The RSI for TRX/USD is about to break the 50 level.
Key Support Levels – $0.0185 and $0.0200.
Key Resistance Levels – $0.0172, $0.0165 and $0.0160.
Source: livebitcoinnews.com
View original post


