
Etherium Price AnalysisPrice Analysis
Ethereum Price Analysis: ETH Rebounds at Crucial Support; Are Bulls Plotting a Move?
Ethereum’s price saw a notable increase of 5% today, rising to $194.71. The bounce was short-lived, however, and the price subsequently declined by 8.41%. The good news is that Ethereum has rebounded at long-term support, and it looks like it will hold.
This latest rebound is also supported by the increase in the price of BTC. If ETH can continue to rise against BTC, we could see a strong resurgence. ETH remains the second-largest cryptocurrency by market value with a market cap of $20.88 billion.
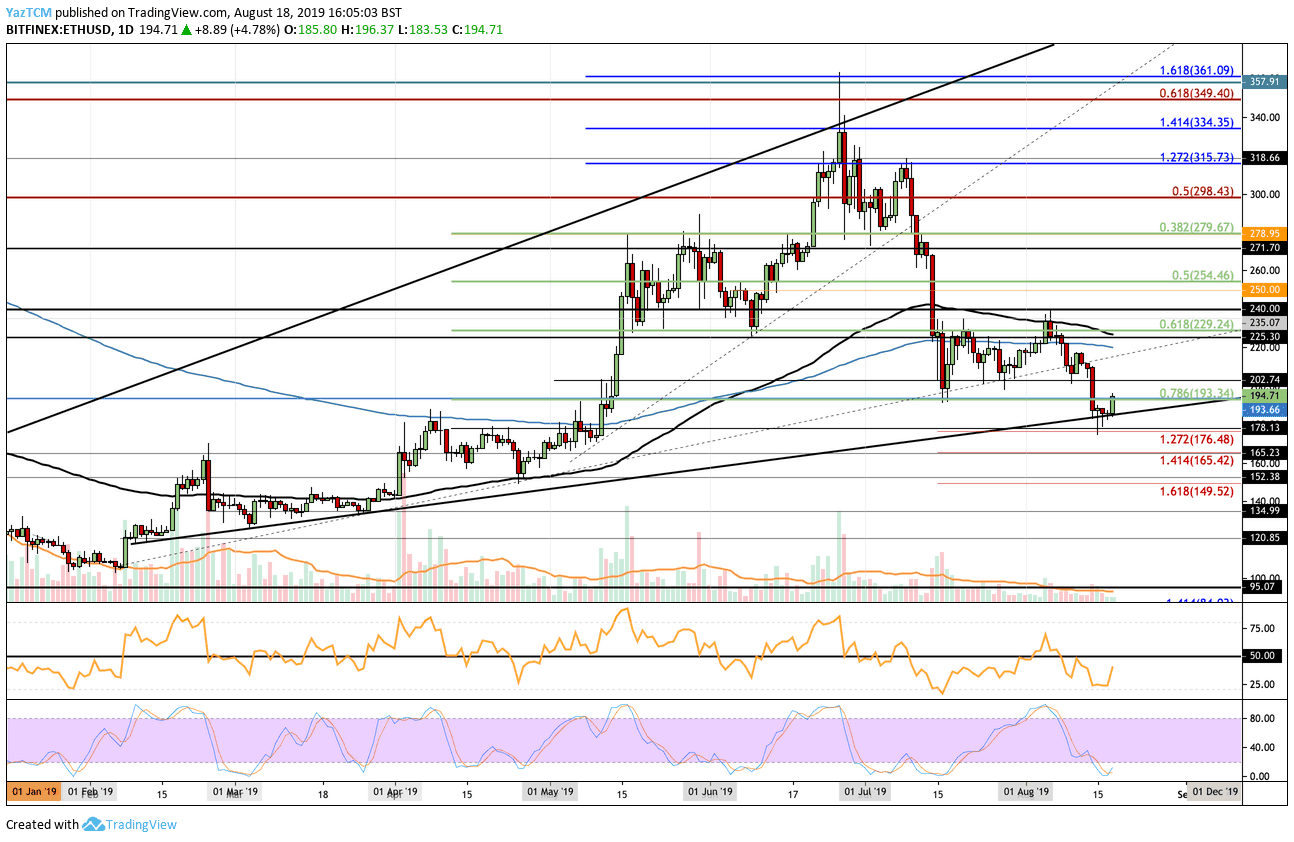
Looking at the ETH/USD 1-day chart:
- After our previous ETH/USD analysis, Ethereum’s price dropped below support at $202 and $200 and continued lower until finding solid support at the 6-month-old rising support line. The price momentarily spiked even lower but found support at the $176.50 level (provided by the downside 1.272 Fib extension).
- From above: If the market can climb above the current resistance around $193.34, the next levels of contention for the Ethereum bulls lie at $200 and $202. Above $202, higher resistance lies at $220 (200-day EMA) and $225 (100-day EMA). If the bulls continue above this congestion, higher resistance lies at $250, $250, $254, $271, and $279.
- From below: The nearest level of support lies at the rising trend line. Beneath this, we can expect further support at $176.48, $165.24 (downside 1.414 Fib extension) and $149.52 (downside 1.618 Fib extension).
- The trading volume remains below average.
- The Stochastic RSI is showing promise after delivering a bullish crossover signal in oversold territory. If the Stochastic RSI continues to expand, we will certainly see Ethereum priced above $200 very soon.
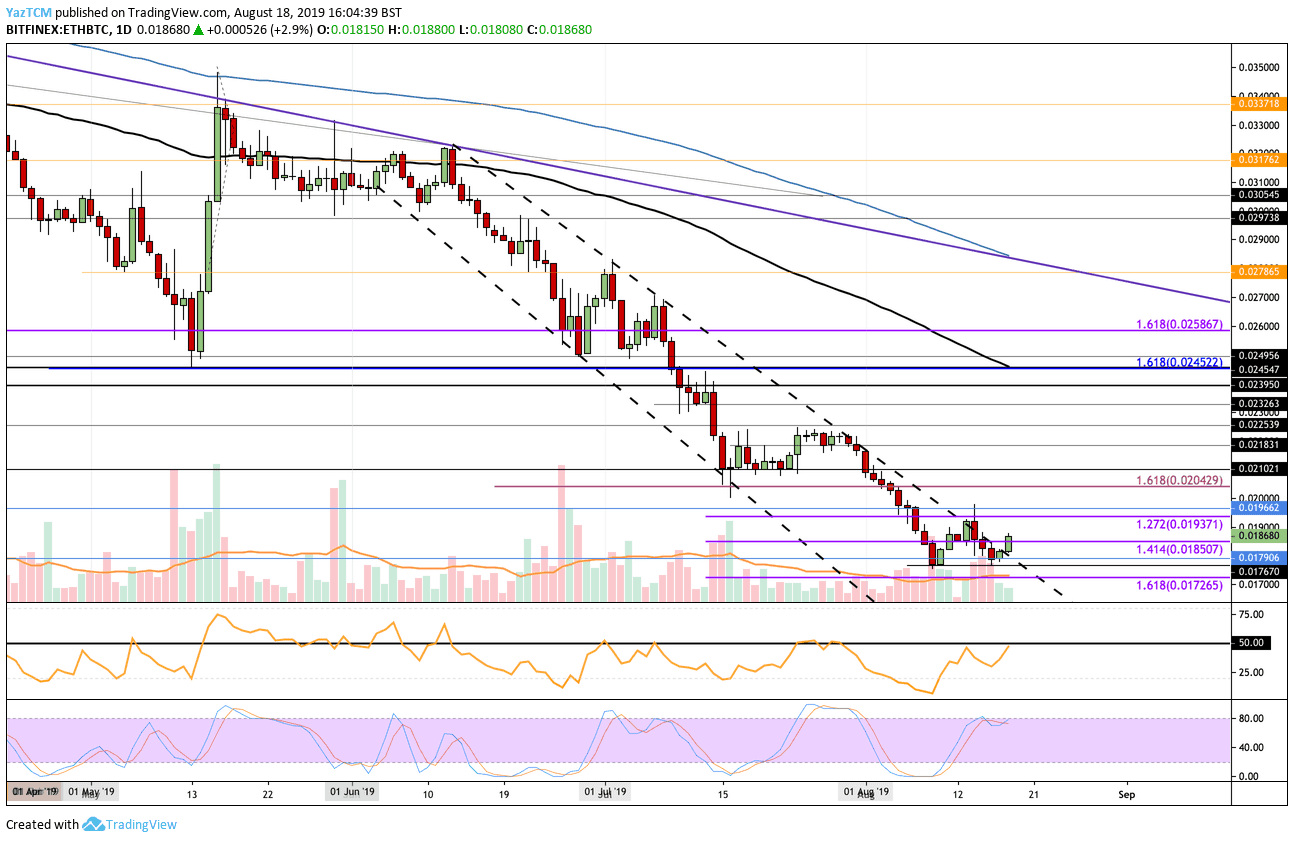
Looking at the ETH/BTC 1-day chart:
- Trading against Bitcoin, the breakout we mentioned in our previous analysis was false. The market rolled over and fell back within the boundaries of the descending price channel. However, today Ethereum broke above the falling price channel. We will need to wait for a candle close to confirm this breakout, but if true, we could see Ethereum’s price rise significantly very soon.
- From above: The nearest levels of resistance lie at 0.01966 BTC and 0.02 BTC. If the price breaks through the latter, higher resistance lies at 0.0204 BTC, 0.021 BTC, 0.02183 BTC, 0.02 BTC, and 0.0225 BTC.
- From below: The nearest level of support lies at 0.0185 BTC. Beneath this, we can expect support at 0.018 BTC, 0.017906 BTC, and 0.017670 BTC.
- The trading volume is starting to show signs that it may increase over the next few days.
- The RSI is currently battling the 50 level, which shows that the bulls are trying to take control. To see ETH/BTC surge, we would need to see the RSI climb and remain above 50.
Be the first to know about our price analysis, crypto news and trading tips: Follow us on Telegram or subscribe to our weekly newsletter.
Source: cryptopotato.com
View original post


