
Etherium Price AnalysisPrice Analysis
Ethereum Price Analysis: ETH Eyes 0.02 BTC; Is This a Shift in Trend?
The price of Bitcoin has declined substantially over the past 24 hours, causing a lot of altcoins to drop in value against the US dollar. Trading against BTC, however, the situation is much different. At the time of this writing, ETH is up approximately 4% against Bitcoin and is trading close to the 0.02 BTC mark.
If Ethereum can continue to rise in value against Bitcoin, we may see a shift from the previous bearish pressure that the cryptocurrency experienced.
Ethereum remains the second-largest cryptocurrency by market value with a market cap of $22.20 billion.
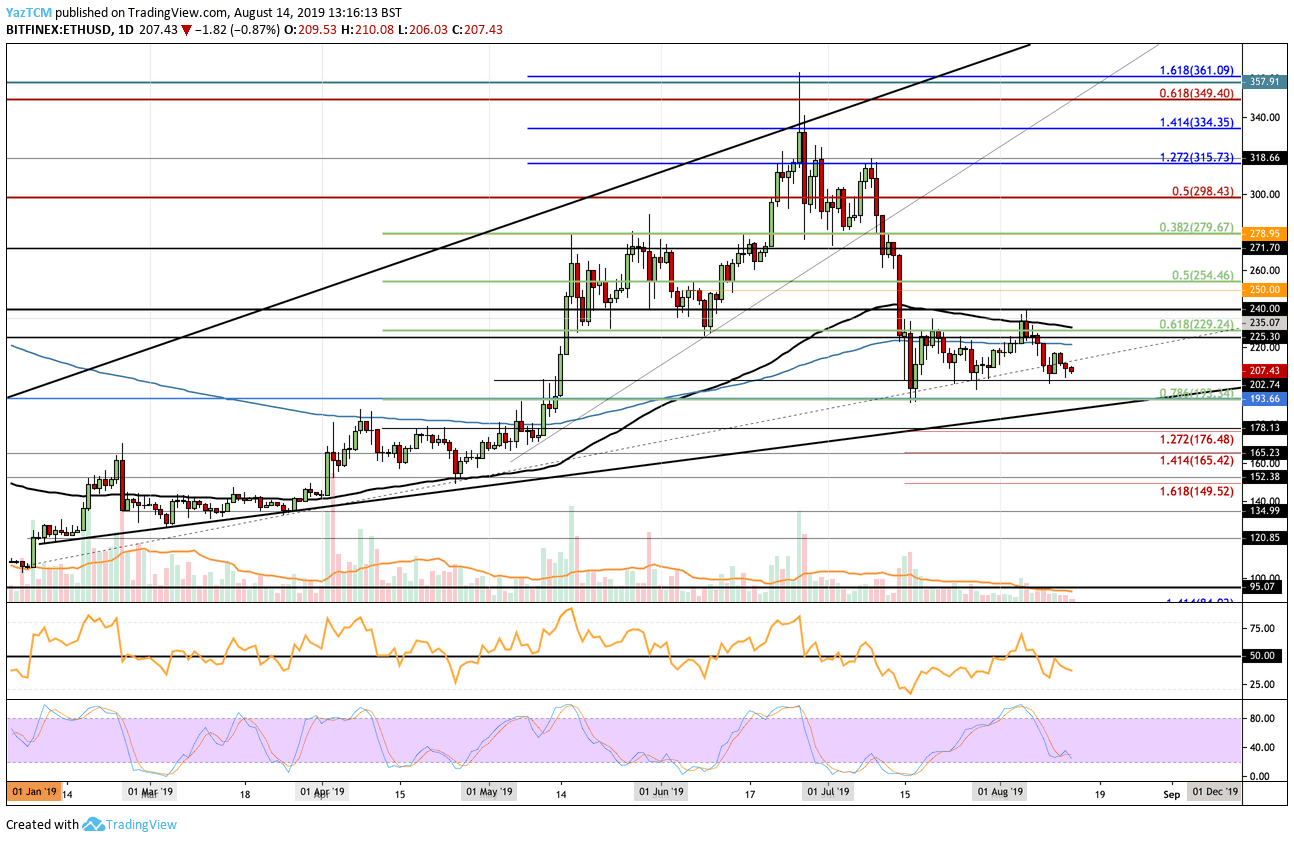
Looking at the ETH/USD 1-day chart:
- Since our previous ETH/USD analysis, the resistance at the 100-day EMA proved too strong for Ethereum, causing the market to roll over. Over the next few days, the ETH price continued to decline and broke beneath a multi-month rising support line.
- From above: The nearest levels of resistance are $210, $220 (200-day EMA), and $235 (100-day EMA). This combined area of resistance will require significant momentum to overcome. Above this, higher resistance lies at $240, $250, $254, $271, $279, $298, and $300.
- From below: The nearest levels of support are $202 and $200. If the sellers can push the market beneath $200, further support is expected at $193 where the .786 Fibonacci retracement level lies. Strong support beneath this is located at the rising support trend line. If the sellers break beneath $180, further support will be found at $176.48, $165.42, and $150.
- The trading volume remains relatively low and below average.
- The RSI has remained beneath 50, which is a bad sign as it signals that the sellers have retained control.
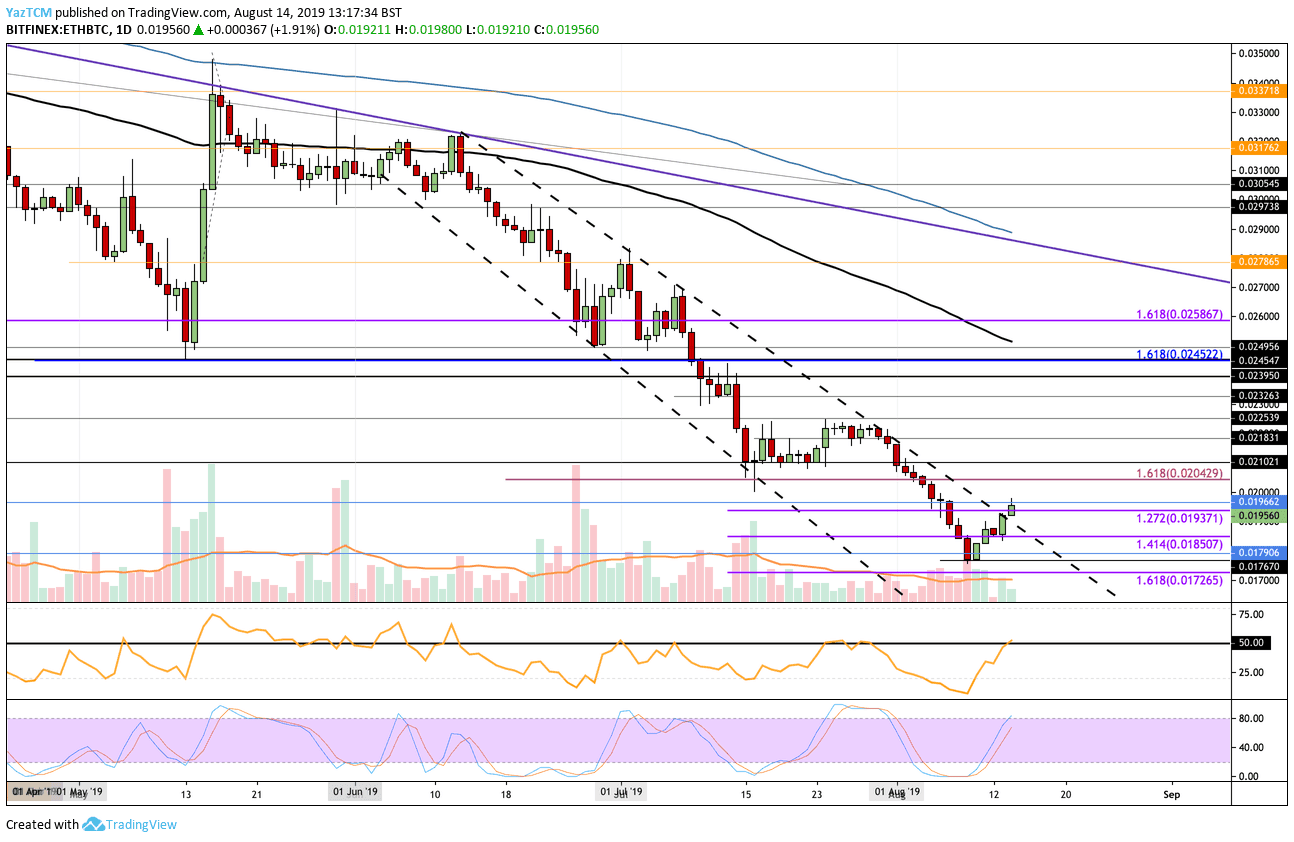
Looking at the ETH/BTC 1-day chart:
- After rebounding around 0.0176 BTC, Ethereum has climbed higher. In today’s trading session, ETH managed to break above a 2-month-old downward sloping channel. If it can continue to rise from here, this may mark a major shift in trend.
- From above: The nearest levels of resistance lie at 0.01966 BTC and 0.02 BTC. If the buyers drive the price above 0.02 BTC, we can expect higher resistance at 0.02049 BTC, 0.021 BTC, 0.02183 BTC, 0.0225 BTC, 0.00236 BTC, and 0.024 BTC.
- From below: The nearest level of support lies at 0.01937 BTC. Beneath this, further support is found at 0.019 BTC, 0.0185 BTC, 0.018 BTC, and 0.0179 BTC.
- The trading volume is starting to show signs of increasing, which is a positive sign.
- The RSI is about to break above 50 for the first time in 2 months.
Be the first to know about our price analysis, crypto news and trading tips: Follow us on Telegram or subscribe to our weekly newsletter.
Source: cryptopotato.com
View original post


