
Cryptocurrency Market Analisys: Bitcoin Seems Bad And Altcoins Are Not Better

Bitcoin has gone into a serious correction. At the moment, there is still potential for declining to the level of $ 9900. From this point the exchange rate can move into a new wave of growth as part of the development of a reversal model.
It is important to prevent a drop below the level of $ 9000 of “digital gold”; a strong downward correction is expected to continue there.
The influence also persists on altcoins – we are witnessing the formation of head and shoulders reversal patterns on Litecoin and Bitcoin Cash. In the case of renewing lows, these assets keep moving down swiftly.
At the same time, EOS and Ethereum, on the contrary, are set for a positive upward rebound after another wave of a downward correction.
Bitcoin
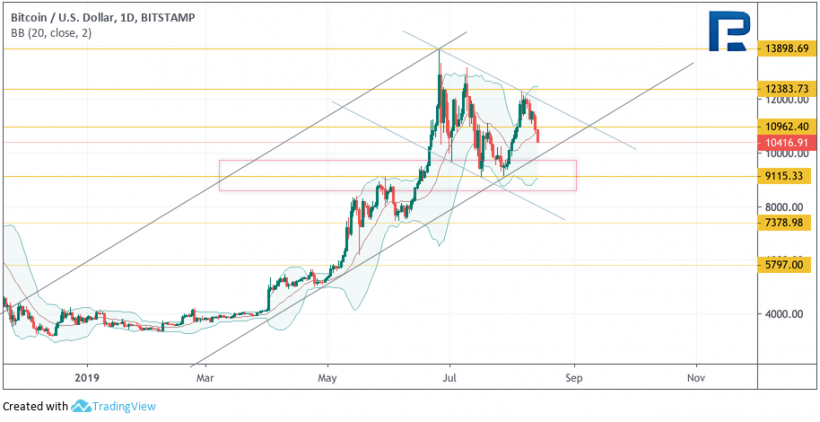
The leading digital asset is being corrected as part of the formation of the inverted Head and Shoulders model. The key support is the level of $ 9115. The breakdown of this area will indicate the quotes moving beyond the rising channel and the continuation of the decline with the target at $ 7475.
As the main trading idea, BTC is expected to rebound from the lower border of the channel near the $ 9500, with the subsequent rise to the first target at $ 12,385. A breakdown of this resistance will lead to continued growth above the $ 13,900 level. It is also worth noting the appearance of a large number of forecasts from various analysts and companies in favor of strong growth shortly. There is potential for such a lift, but the bulls need to keep the price above $ 9115.
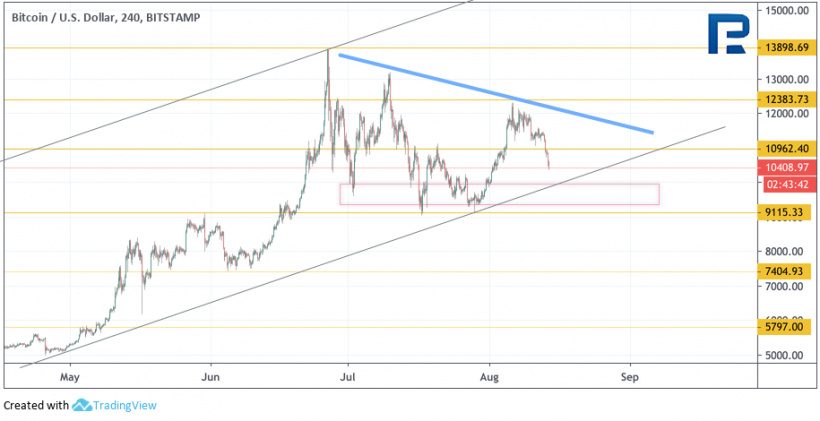
We observe the formation of a reversal model on a 4-hour chart. Expect the completion of the right “Shoulder” is near the area of $ 9450- $ 9200. Ideally, it should be slightly higher than the left “Shoulder”, which will demonstrate the weakness of sellers and give rise to a reversal of quotes up.
Bitcoin will able to drop below $ 9115. This portends the continuation of the movement in the opposite direction to the height of the pattern, therefore, one should not exclude a serious decrease downwards when the area of $ 9000 is broken. In general, modern traders in most cases try to buy already at the moment of formation of the right “Shoulder”, after which they increase the volume of positions with a breakdown of the “Neck” line.
Ethereum
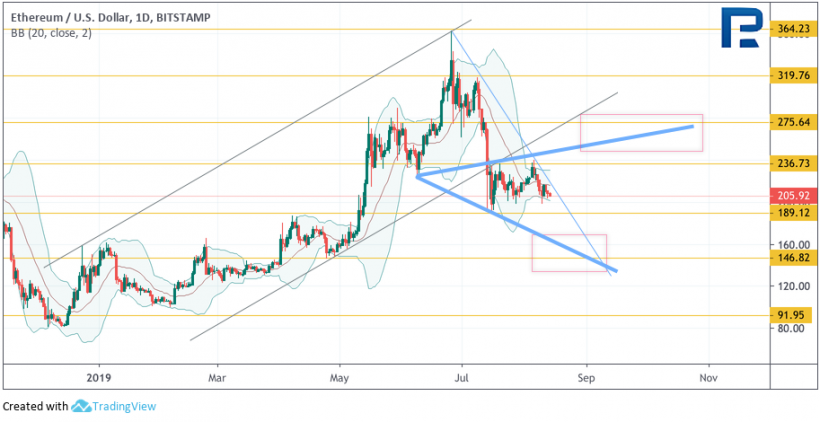
The second cryptocurrency came close to the support area of about $ 190. As we can see, buyers were not able to break through the resistance and gain a foothold above the level of $ 235, despite several attempts to make a breakdown. This indicates a likely continuation of the decline with a potential target of $ 145. Here we should expect the completion of the formation of the bullish “Wolfe Wave” model and the start of ETH growth above the level of $ 275 as part of the pattern development. Confirmation of the rise will be a breakdown of the downward trend line. ETH/USD will be able to break a level of $ 145, which will indicate a decrease in the level of $ 90.
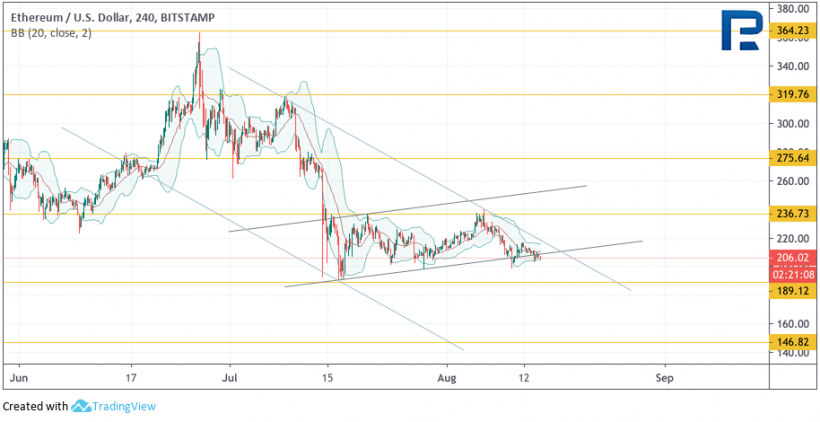
ETH/USD could gain a foothold under the ascending trend line, which also indicates the potential for continued decline to the first target at $ 190. A breakdown in this area will indicate a fall even lower – to the level of $ 145, near which we can expect the beginning of a growth within the framework of the upward model. In general, the asset continues to decline within the bear channel. The scenario will be able to end with the development of the downward movement will be the exit of quotes outside the channel and consolidation above the level of $ 235, in which case the growth target will be an area of about $ 275.
EOS
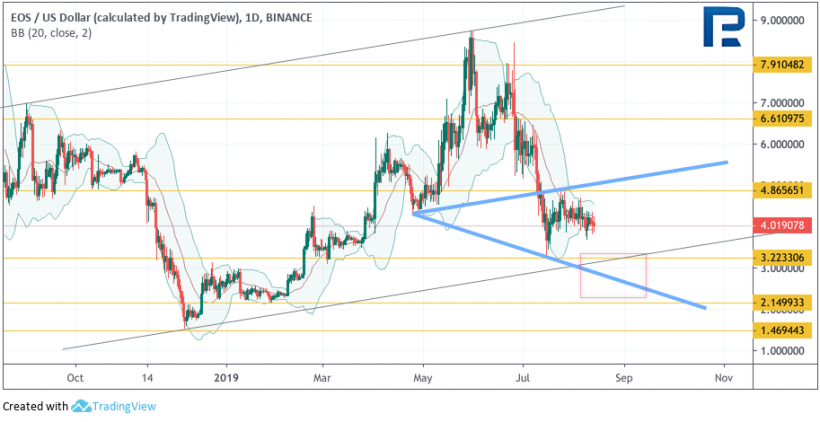
EOS/USD “stuck” in the middle between resistance and support levels on the daily chart. Briefly, the asset rate has already pushed off the upper border of the Bollinger Bands indicator, which indicated pressure from sellers. At the moment, quotes are trying to break through the lower border of the indicator bands.
In the main scenario, we should expect continued decline with the test level of $ 3.20. Here is the lower boundary of the ascending channel, from which the cryptocurrency can well perform a rebound. A bullish Wolfe Wave pattern is also forming with a buying area near $ 2.35. The goal of testing this model is the level of $ 5.00. We can expect the growth to the level of $ 2.15, which will indicate a potential test area of $ 1.45.
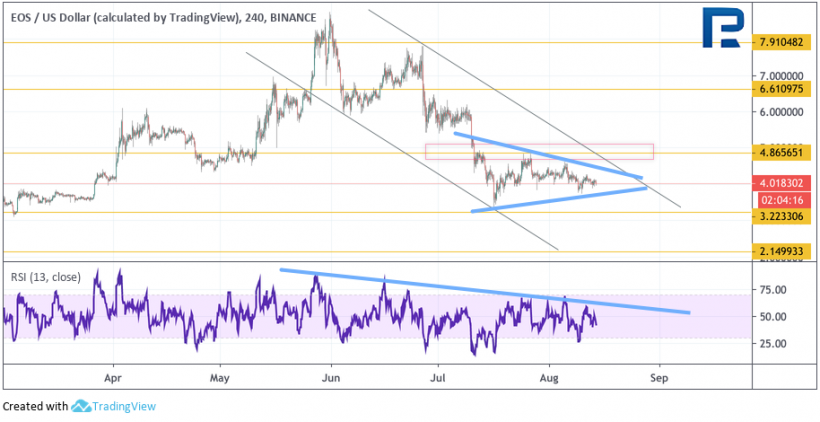
On a 4-hour chart, the asset is clamped as part of the Triangle model. As before, we are seeing a decrease in volatility in anticipation of the release of EOS quotes in one direction. The price pushed several times from the resistance level by $ 4.85, which indicates a more probable breakdown of the model down intending to fall to the level of $ 2.15. In favor of this movement is a rebound from the trend line on the RSI indicator.
The cancellation of this option may be a breakdown of the upper boundary of the model and fixing quotes above the level of $ 4.85, which will confirm going beyond the channel and provoke growth above the level of $ 6.60.
Litecoin
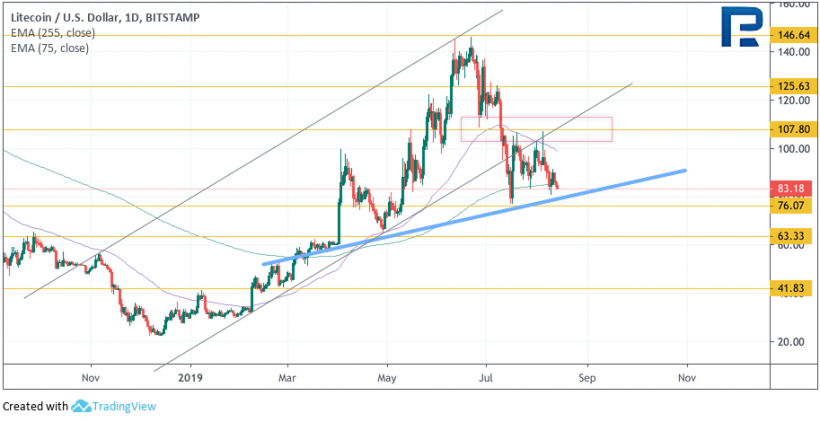
Digital Silver remains under pressure from the formation of the head and shoulders reversal pattern. If sellers succeed in gaining a foothold below the level of $ 75.00, we should expect an attempt to reduce to develop a reversal model with targets near $ 40.00. To cancel the negative option, the asset needs to show growth and eventually break through the level of formation of the right “Shoulder”.
Buyers need to keep LTC quotes above $ 107.80, in which case it will be possible to return to the option with continued growth. It is worth noting that previously such a model was already being formed at the top, while the rate fell from the level of $ 130.00 to $ 76.50.
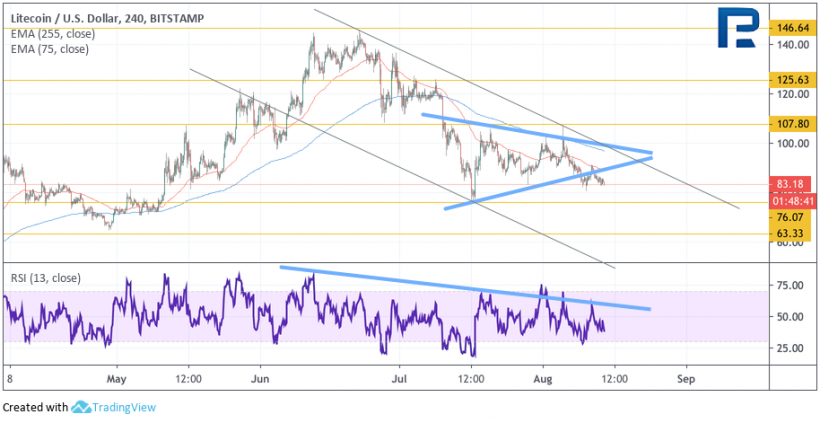
LTC/USD broke through the lower boundary of the Triangle model on a 4-hour chart. Expect a continuation of the fall with a potential target of $ 63.35. In favor of this movement is another rebound from the resistance line at the RSI. The cancellation of the scenario with a decrease will be a strong growth and a breakdown of the upper boundary of the downward channel, in which the targets will be the levels of $ 107.80 and $ 125.65.
Bitcoin Cash
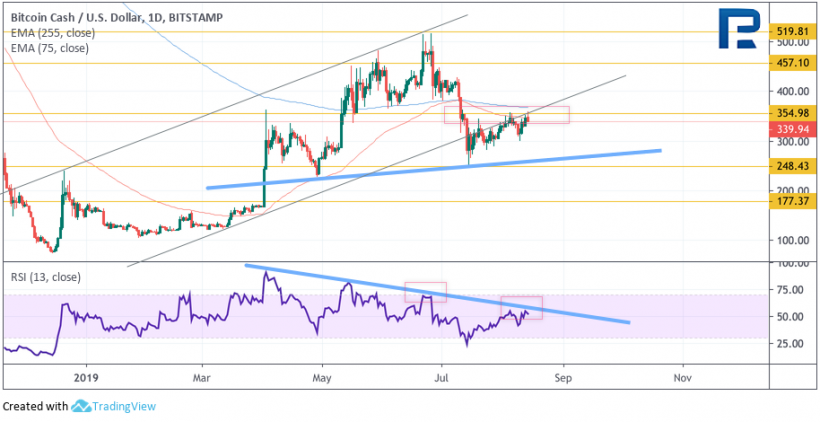
The daily chart of Bitcoin Cash still looks ready for an aggressive fall as part of the completion of the formation of the head and shoulders reversal pattern. Moreover: the values of the RSI indicator test the resistance line, which in itself acts as a strong signal in favor of lowering BCH.
A confirmation of this idea and a signal to complete the formation of the model will be a breakdown of the support level and consolidation at $ 245.00. The cancellation of the option with a decrease will be a breakdown of the resistance level and the return of quotations inside the rising channel, which will indicate a potential continuation of the rise to the first target at $ 455.00.
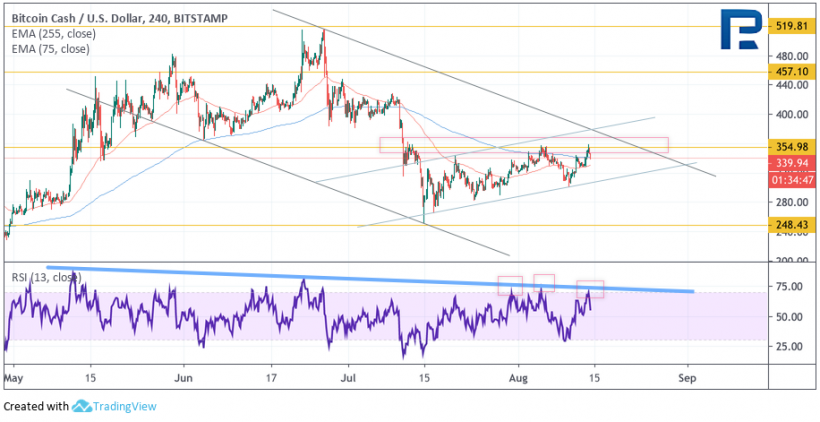
On a 4-hour chart, quotes move in a downward channel. A rebound from the upper boundary of the channel is still expected and the decline will continue with the first target at $ 248.45. A strong signal in favor of such a fall is a rebound from the resistance line at the RSI, and confirmation will be a breakdown of the lower boundary of the rising channel.
The cancellation of the option with the fall will be a breakdown of the upper boundary of the downward channel and fixing the asset price above the level of $ 400.00, which will indicate a potential increase for the test of $ 457.10.
Source: en.bit.news


