
Cryptocurrency Market Analisys: The Rally Of Altcoins Is Possible
 Bitcoin continues to get the highs and there is a high probability of continued growth. Unfortunately, other digital assets are not ready for strong growth right now.
BTC/USD correction will provoke another strong drop in the cryptocurrency market, after which other assets will also be possible to rise. For example, the formation of head and shoulders reversal patterns is obvious on the daily charts of Litecoin and Bitcoin Cash. These altcoins can move deep down as part of the development of these patterns with the breakdown of the nearest lows.
However, if the main cryptocurrency can leave the descending channel soon, this will give confidence to the bulls trading in various crypto assets.
Bitcoin
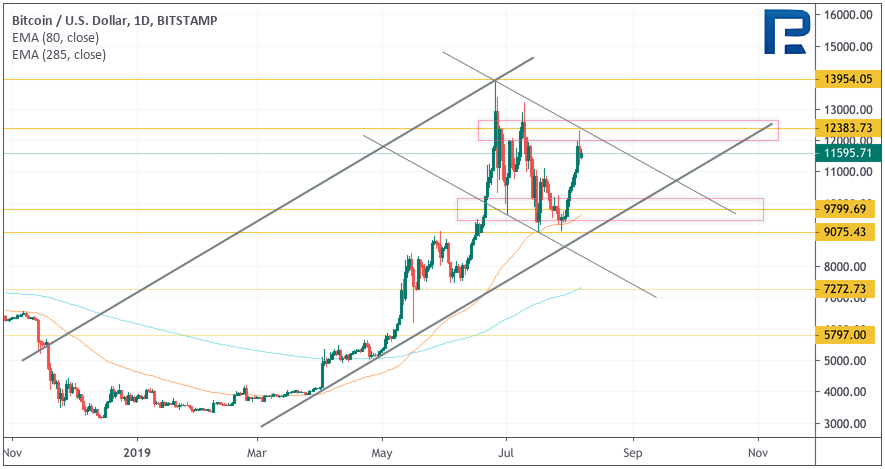
The leading cryptocurrency was able to demonstrate a qualitative rebound from the support level again. At the moment, BTC/USD is testing the upper border of the downward channel. A strong signal in favor of further growth is another rebound from the moving average. This indicates pressure from buyers and the reluctance of the market to go into a deep correction.
A confirmation of the rise in the digital gold rate will be a breakdown of the upper boundary of the downward channel and consolidation above the level of $ 12,385. In this case, the growth target will be the area above the $ 15,000 mark.
In a case of a strong fall with the breakdown of the support level Bitcoin fixes at $ 9075. Such a negative scenario may move the price even to the level of $ 7275.
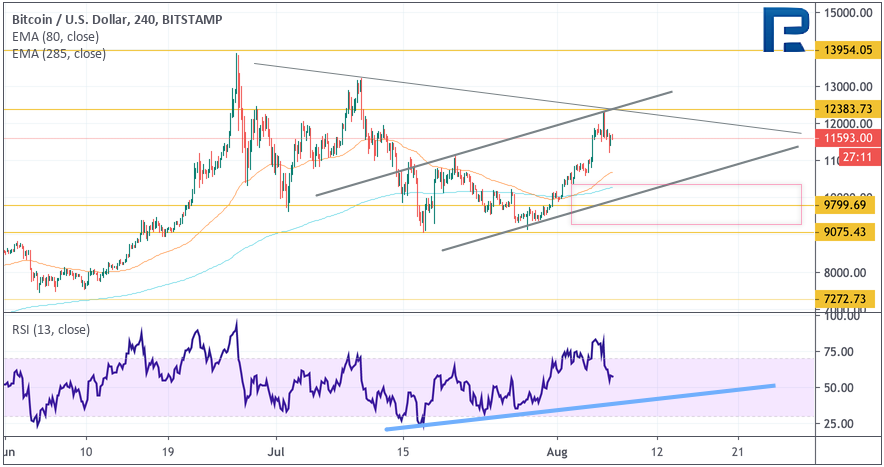
On the 4-hour chart, several options for the development of further movement can be distinguished. As the most conservative scenario, it is worth considering a correction to the support level of $ 9800, where the formation of an inverted Head and Shoulders model is expected.
With a breakdown of the level of $ 12,385, we can talk about the achievement of the formation of the model and the continuation of the upward movement. The target of the rise will be the level of $ 15,950. Therefore, an interested zone is the area near the levels of $ 9800-9075.
An additional signal in favor of this option will be a rebound from the support line on the RSI. The formation of a reversal model will be a fall and a breakdown of the level of $ 9075, which will indicate the abolition of the pattern and the continued development of a downward correction.
Ethereum
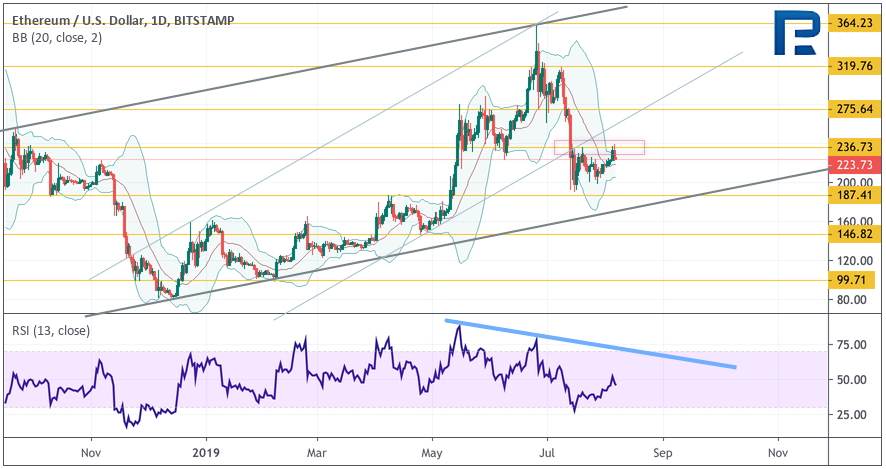
ETH/USD tests the resistance level for the second time, where the upper border of the Bollinger Bands is located. This signal indicates pressure from sellers.
As the main scenario, cryptocurrencies could drop to the level of $ 185. An additional signal in favor of a decrease may be a rebound from the trend line on the RSI indicator. However, the support level is quite far, so a decline can occur without a test.
The level of $ 145 is interesting for buyers, then the price can up to the level of $ 275.
To cancel the negative scenario, it is important for the bulls to gain a foothold above the level of $ 235, which will indicate a breakdown of the upper boundary of the Bollinger Bands and give the potential for the asset to return to the upward trend phase.
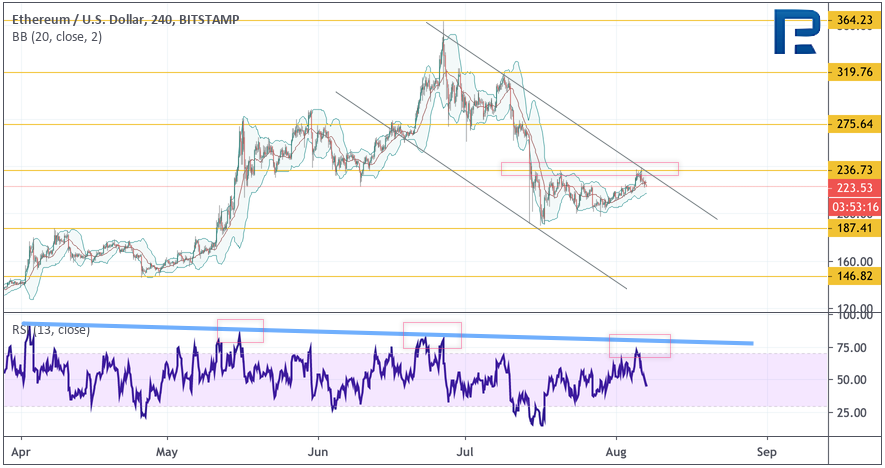
On the chart, Ethereum was also unable to break through the resistance and go into the full development of the Triangle model. As a short-term option, it is expected to fall to the level of $ 187, with the breakdown of which the road to $ 146 will be opened. In favor of this scenario, another rebound from the trend line on the RSI indicator is also in favor. As you can see, the indicator values break through region 30, and at the same time repel from level 70, which indicates the presence of a bearish impulse.
It is worth talking about a return to growth only after a breakdown of resistance and fixing quotes of the digital asset above the level of $ 236.
Litecoin
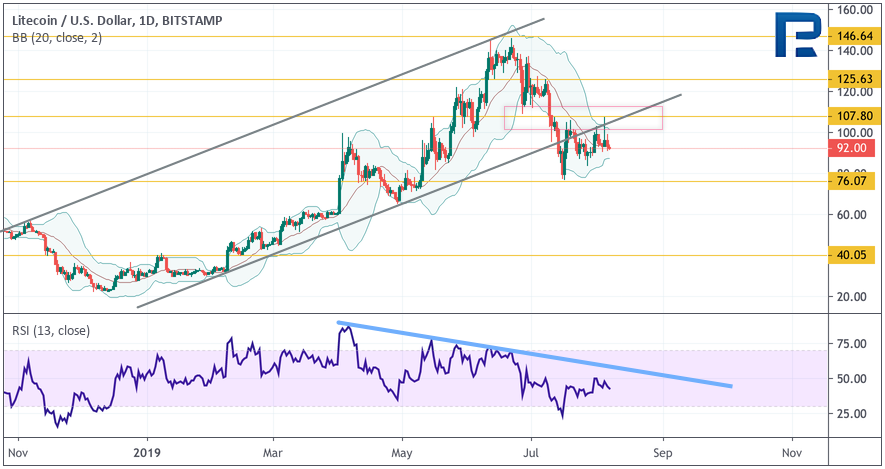
Digital Silver keep trading under the resistance line, which acts as the lower boundary of the rising channel. Quotes for the second time tested the level of $ 107.80, but the bulls failed to gain a foothold higher. Therefore, it is premature to talk about a turn-up.
As the main trading idea, a fall and another test of the support level is expected – $ 76. A breakdown of this area will indicate a further decline to the levels of $ 60-50. In favor of such a negative scenario, the market’s unwillingness to break the downtrend line on the RSI indicator is also in favor.
In general, the price structure on the daily chart of the digital asset indicates the formation of the next head and shoulders reversal pattern. Such a pattern can greatly drop the price. However, it is important to remember that all models work with a certain degree of probability, never reaching 100%.
The cancellation of the formation of a reversal pattern will be a strong growth and the breakdown of the level of $ 125.
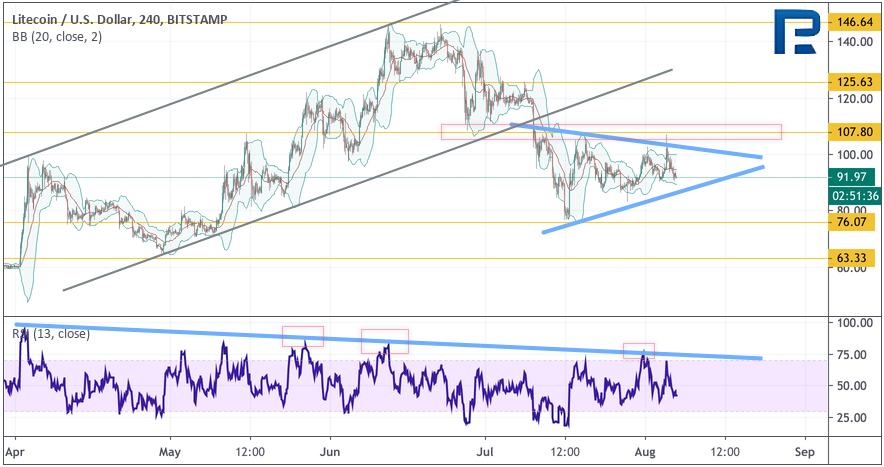
On a 4-hour chart, LTC/USD is clamped within the Triangle model. This indicates the presence of uncertainty until the price goes beyond the model. Based on the regular bounce of the RSI indicator values from the resistance line, we can assume that the breakdown of the pattern will take place exactly down and its potential target will be the level of $ 63.
The cancellation of this option will be a breakdown of the upper boundary of the model and fixing quotes above $ 107.80, which will indicate a short-term victory for the bulls and the beginning of growth towards the target by $ 125.65.
EOS
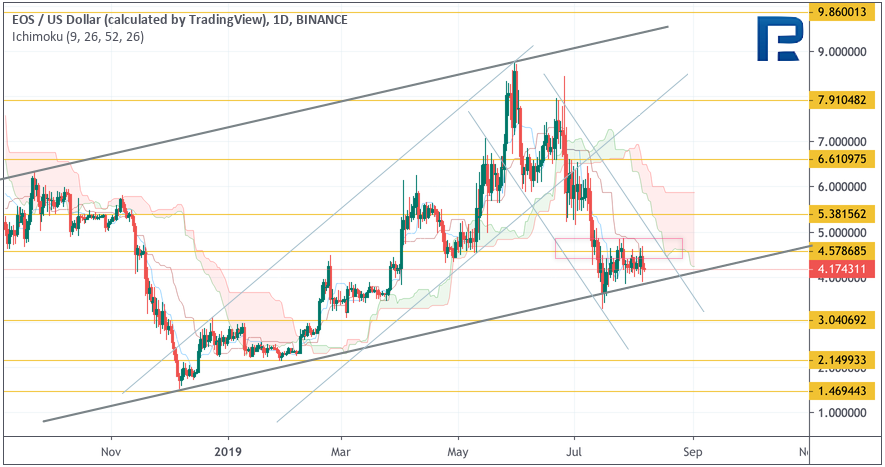
Once again, EOS/USD break up the resistance level of $ 4.57. Moreover, the digital asset continues to move under the Ichimoku cloud, which also indicates a bearish trend. A return to growth should be considered only with a breakdown of the resistance level and fixing quotes above the level of $ 6.
As the main trading idea, we expect a rebound from the lower boundary of the Cloud and a fall to the first target at $ 3.05 with a probable test area of $ 2.15. A confirmation of the decline will be a breakdown of the lower boundary of the ascending channel and consolidation below the level of $ 4.
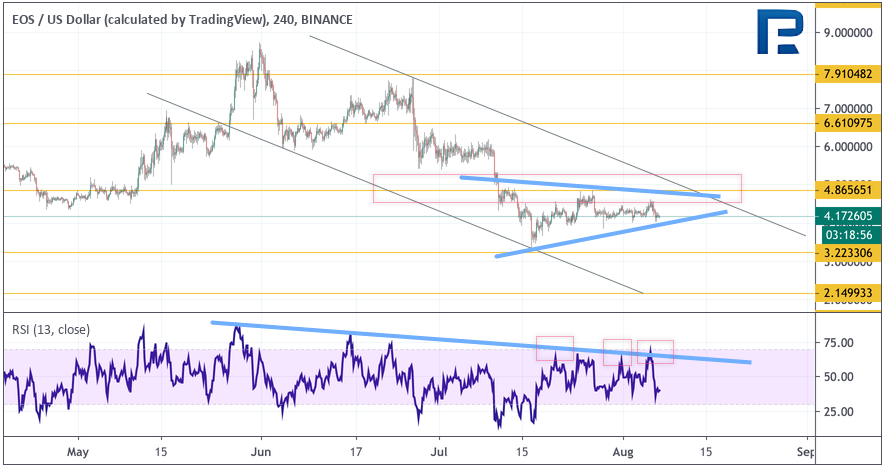
On the 4-hour chart, you can see the movement within the formation of the “Triangle”, indicating a decrease in volatility, followed by a strong exit in one direction. Another rebound from the resistance line on the RSI indicator indicates that such a breakdown is likely to take place down. His first goal will be the level of $ 3.20, and then a decrease to the level of $ 2.15.
An important resistance for bears is the level of $ 4.85, a breakdown of which will indicate potential growth with a test level of $ 6.60.
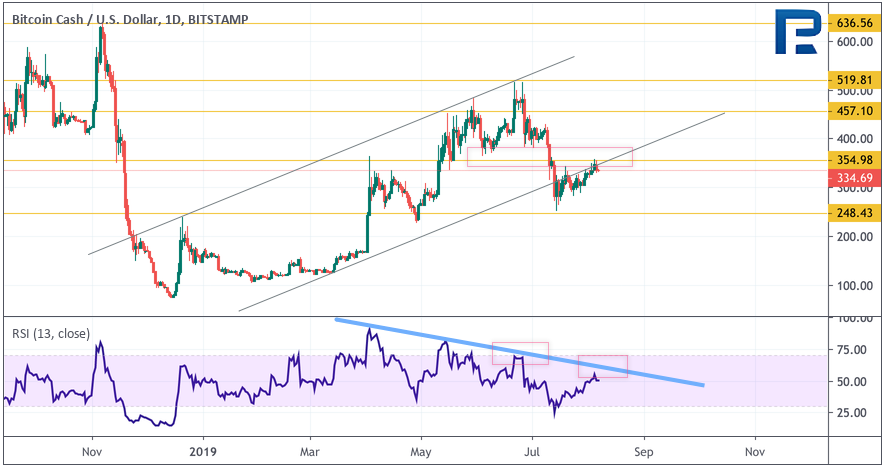
Bitcoin Cash
On the daily chart, the Bitcoin Cash cryptocurrency still does not look ready for a new growth wave. The price tested resistance near $ 355 and at the moment we are seeing another rebound.
However, the asset continues to remain below the lower boundary of the upward channel. A test of a downward resistance line on the RSI indicator will also be in favor of a potential drop to the level of $ 248. With consolidation below the level of $ 248, one should not exclude the completion of the formation of the “Head and Shoulders” reversal model, which can send the asset’s chart far down. To cancel this scenario, it is important for the bulls to show strong growth and a breakdown of the level of $ 400, thereby returning quotes inside the rising channel, after which it will be possible to talk about continuing the rise.
On the four-hour chart, there is still potential for a decline in the “5-0” downward pattern. Another drop in the trend line on the RSI indicator is also in favor of falling quotes, which again indicates pressure from the bears. Moreover, a breakdown of the ascending support line on the indicator has already taken place, which indicates a potential breakdown of the lower boundary of the channel and a fall with the target at the level of $ 248.
The strong growth and a breakdown of the level of $ 400 would lead cryptocurrency to $ 457 with the resumption of the bullish trend.
Source: en.bit.news


