Ethereum Price Analysis: ETH Could Nosedive If $192 Support Fails To Hold
- Ethereum price is struggled to recover above $220 and $225 against the US Dollar.
- ETH price is somehow holding the key $200 and $192 support levels.
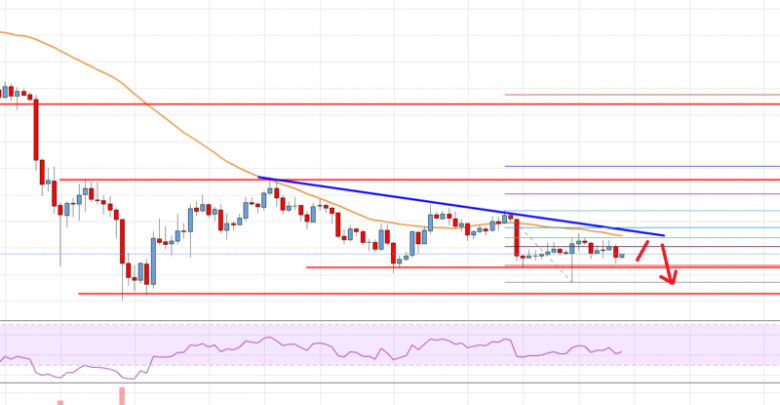
- There is a major bearish trend line forming with resistance near $214 on the 4-hours chart (data feed from Coinbase).
- The price could decline heavily if there is a clear break below the $200 and $192 support levels.
Ethereum price is trading in a bearish zone below $220 and $235 against the US Dollar. ETH price is approaching the next key break either above $220 or below $200.
Ethereum Price Analysis
In the past few days, there was a steady decline from $235 in Ethereum price against the US Dollar. The ETH/USD pair formed a swing high near $235 and later declined below the $225 and $220 support levels. Moreover, there was a close below the $220 level and the 55 simple moving average (4-hours). It opened the doors for more losses below $212 and $210. Finally, the price spiked below the $200 support and traded to a new monthly low at $191.
Recently, there was an upside correction, but the recovery was capped by the $225 resistance and the 55 simple moving average (4-hours). The last swing high was near $224 and the recent low was near $197. Recently, the price recovered above the 50% Fib retracement level of the downward move from the $224 high to $197 low. However, the bulls struggled to gain momentum above the $215 resistance and the 55 SMA.
Moreover, the 61.8% Fib retracement level of the downward move from the $224 high to $197 low also acted as a resistance. On the upside, there is a strong resistance forming near the $214-215 area. There is also a major bearish trend line forming with resistance near $214 on the 4-hours chart. Therefore, an upside break above the $215 level plus a close above the 55 SMA might start a strong upward move.
The next important resistances are near the $220 and $225 levels. On the flip side, if the price breaks down below the $200 support, there could be sharp losses. More importantly, a downside break below the $192 swing low could push the price towards $180 or even $165.

Looking at the chart, Ethereum price is clearly approaching the next major break either above $215 and $220 or below the $200 handle. There are chances of an upside break if bitcoin price jumps above $10,000 in the near term.
Technical indicators
4 hours MACD – The MACD for ETH/USD is currently losing momentum in the bearish zone.
4 hours RSI (Relative Strength Index) – The RSI for ETH/USD is slowly moving higher towards the 45 level.
Key Support Levels – $200, followed by the $192 zone.
Key Resistance Levels – $215 and $225.
Source: livebitcoinnews.com
View original post


