
Etherium Price AnalysisPrice Analysis
Ethereum Price Analysis: ETH Back To $200, Possibly Bullish Against Bitcoin?
Ethereum is currently trading very close to the $200 level as the bulls attempt to gain some form of stabilization after the precipitous 35% drop seen this month. Moreover, Ethereum is starting to show some promising signs against BTC.
Ethereum remains the second-largest cryptocurrency with a market cap of $22.28 billion.
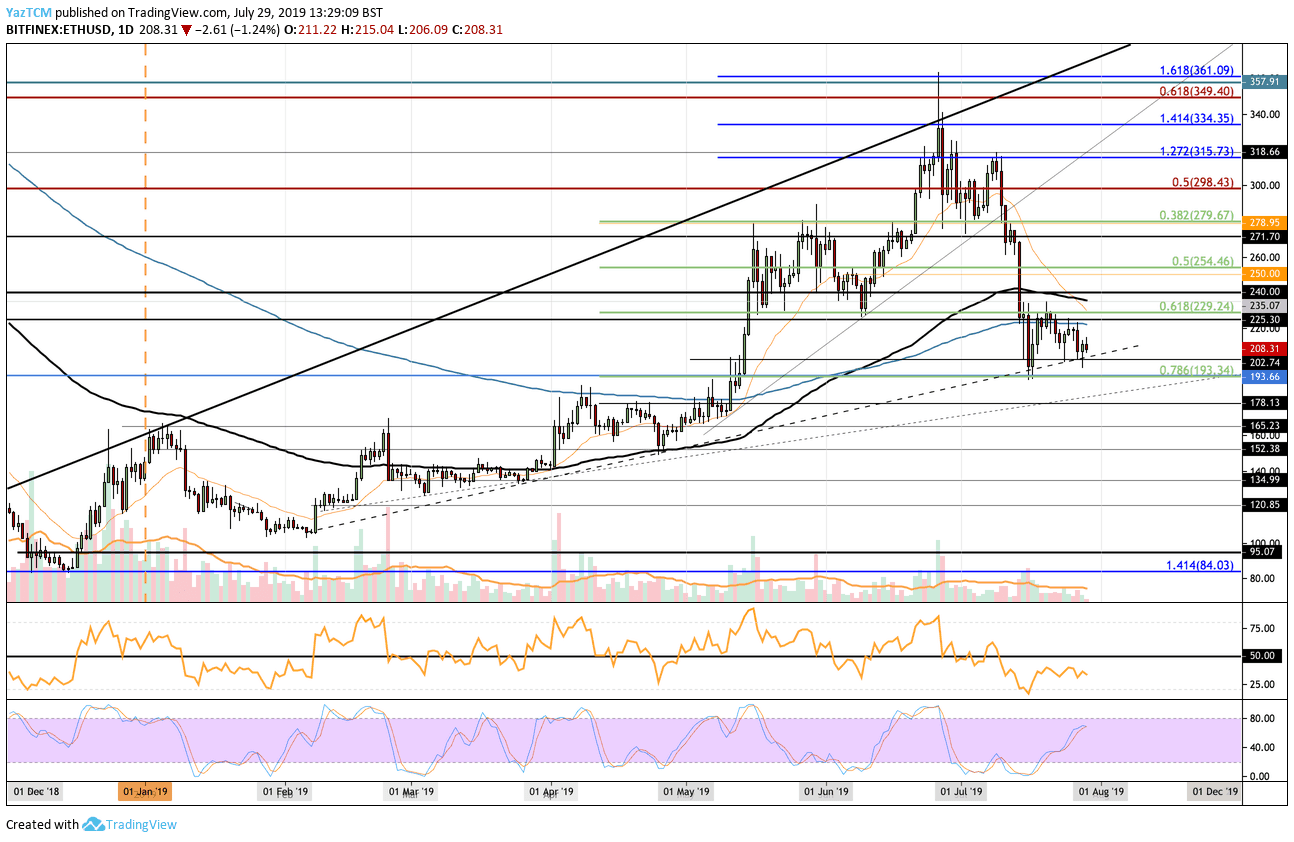
Looking at the ETH/USD 1-Day Chart:
- Since our previous ETH/USD analysis, the resistance at the $230 level was too strong and caused ETH to roll over and fall once again. Ethereum has found support at a rising trend line and has been trapped within the range between $230 and $193 for the past 2 weeks.
- From above: The nearest level of resistance lies at $225. That’s where the 200 days EMA is. Above this, higher resistance lies at $230 and $235 (which also contains the 100 days EMA). If the buyers continue to climb above $240 the next levels of resistance are found at $254, $270, $279, and $300.
- From below: The nearest levels of support lie at the rising dashed support trend line and the $200 level. If the sellers drop Ethereum beneath $200 further support is located at $193 (.786 Fib Retracement). Beneath $193 we can expect lower support at $178, $165, $160 and $150.
- The trading volume has continued to flat out as the month has progressed.
- The RSI remains below the 50 level which indicates that the sellers remain in control of the market momentum. For recovery, we will need to see the RSI break back above the 50 level.
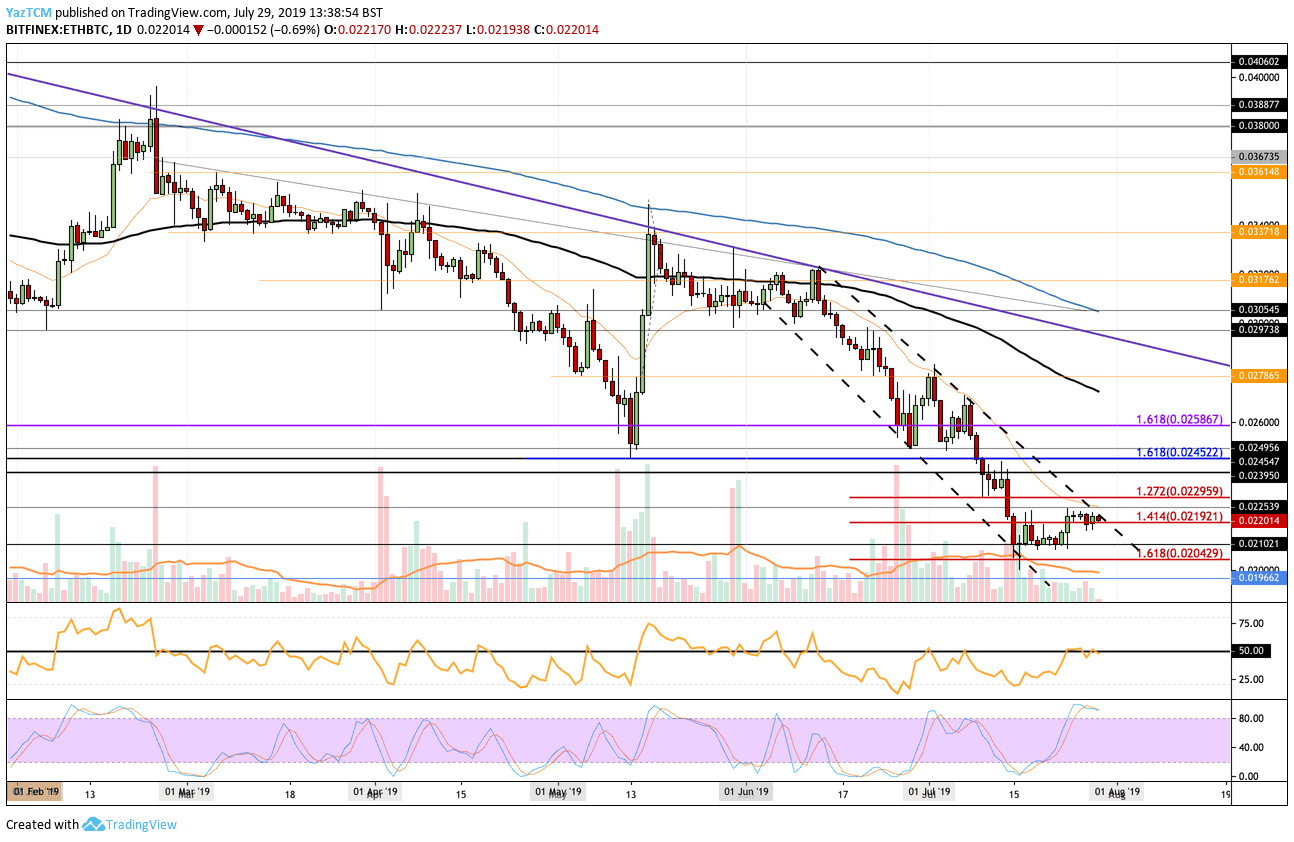
Looking at the ETH/BTC 1-Day Chart:
- Against Bitcoin, Ethereum attempts to plot a comeback. The support at the 0.021 BTC has held very well which has allowed ETH/BTC to rebound higher to where it currently trades at 0.022 BTC. However, ETH remains in a very steep downward channel as it struggled to break above the upper its boundary.
- From above: The nearest level of resistance lies at the upper boundary of the channel. Above this, higher resistance lies at 0.0225 BTC, and 0.0023 BTC. If the bulls continue above the resistance at 0.024 BTC, higher resistance can be found at 0.0245 BTC and 0.026 BTC.
- From below: The nearest level of support now lies at 0.02192 BTC. Beneath this, further support lies at 0.021 BTC and 0.0204 BTC.
- The trading volume has steadily decreased during the month.
- The RSI currently rests at the 50 level which shows indecision within the market. If the RSI can break above the 50 level this will be a promising sign for ETH bulls. However, the Stochastic RSI has recently produced a bearish crossover signal which could potentially signal that the bears are ready for another move lower once again.
Be the first to know about our price analysis, crypto news and trading tips: Follow us on Telegram or subscribe to our weekly newsletter.
Source: cryptopotato.com
View original post


