- Stellar lumen price is currently trading in a positive zone above $0.1100 against the US Dollar.
- XLM price traded as high as $0.1160 and it is well above the 55 simple moving average (4-hours).
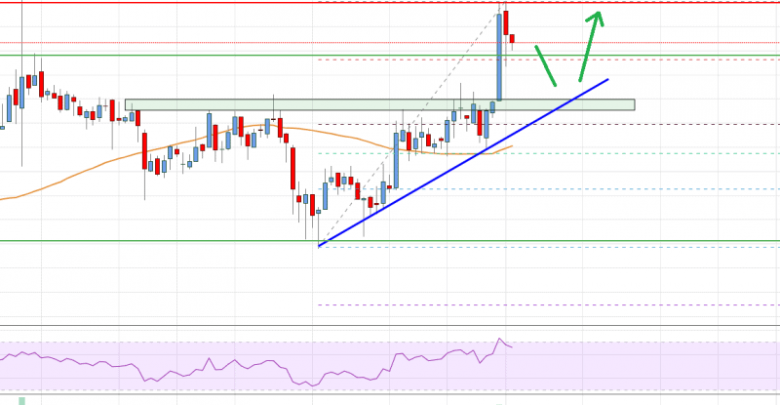
- There is a major bullish trend line forming with support near $0.1080 on the 4-hours chart (data feed via Kraken).
- The pair could continue to rise above $0.1180 as long as it is above the $0.1000 support zone.
Stellar lumen price is currently gaining pace above $0.1100 against the US Dollar, similar to bitcoin. XLM price is likely to accelerate higher above $0.1160 and $0.1180 in the near term.
Stellar Lumen Price Analysis (XLM to USD)
This past week, stellar lumen price formed a strong support near the $0.0980 level against the US Dollar. The XLM/USD pair started a fresh increase and climbed above the $0.1020 resistance level.
There was also a break above the $0.1100 level and the 55 simple moving average (4-hours). A swing high is formed near $0.1160 and the price is currently consolidating gains. An initial support on the downside is near the $0.1112 level. It is close to the 23.6% Fibonacci retracement level of the recent wave from the $0.0957 low to $0.1160 high.
The first major support is near the $0.1080 level. There is also a major bullish trend line forming with support near $0.1080 on the 4-hours chart. The trend line is close to the 50% Fibonacci retracement level of the recent wave from the $0.0957 low to $0.1160 high.
The next major support is near the $0.1040 level or the 55 simple moving average (4-hours), below which the price could revisit the $0.0980 support area in the coming sessions. Any further losses may perhaps push the price into a bearish zone towards $0.0900.
On the upside, the price is facing a major resistance near the $0.1160 and $0.1180 levels. The next major resistance is near the $0.1200 level, above which the price might continue to rise towards the $0.1250 and $0.1260 levels.

Stellar Lumen (XLM) Price
The chart indicates that XLM price is trading nicely in a positive zone above $0.1000. Therefore, the price could continue to rise above $0.1180 as long as it is above the $0.1000 support zone.
Technical Indicators
4 hours MACD – The MACD for XLM/USD is slowly gaining pace in the bullish zone.
4 hours RSI – The RSI for XLM/USD is now well above the 50 level, with a positive bias.
Key Support Levels – $0.1080 and $0.1050.
Key Resistance Levels – $0.1160, $0.1180 and $0.1200.
Source: livebitcoinnews.com
View original post


