Cardano’s Price Landscape: A Bullish Trajectory Beyond $0.30 is More Than Just Plausible
Cardano’s Price Landscape: A Bullish Trajectory Beyond $0.30 is More Than Just Plausible
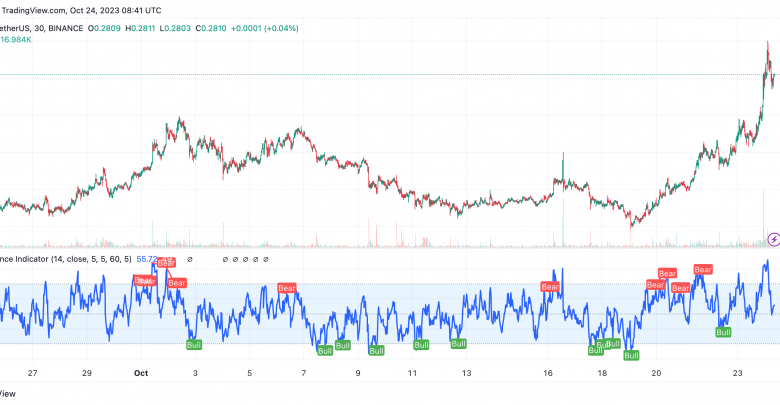
With an eye on the future and feet firmly planted above the $0.278 mark against the U.S. Dollar, Cardano (ADA) has been flashing some bullish signals. Striding confidently above $0.280 and comfortably settling over the 55-simple moving average on a 4-hour chart, the crypto asset seems poised for an upward journey.
Charted Course: An In-Depth Analysis on ADA’s Price
This week is far from ordinary. The crypto-asset known as ADA—short for Cardano—started to significantly ramp up its value, breaking free from the shackles of the $0.250 resistance territory. Pair that with ADA’s dollar performance, and you’ve got a coin that burst through the $0.255 and $0.265 resistance zones with elan.
Diving into the technical details, ADA didn’t just stop at a meager uptick. No, siree! The crypto managed to bulldoze a rather stubborn bearish trend line that had been loitering around $0.2520 on its 4-hour chart. Momentum gathered. Bulls seized the opportunity, and the price skyrocketed all the way to flirt with the $0.288 resistance. But alas, the bears made a cameo, stalling the rally right at the cusp of $0.290. A peak materialized at roughly $0.2899, and now? A phase of consolidation is where we find ourselves.
Surprisingly, or perhaps not so much, ADA still hovers considerably above the 23.6% Fibonacci retracement level. This originates from the swing low of $0.2400 to the most recent high at $0.2899. And it’s not just the Fib levels; the 55-simple moving average on a 4-hour chart also lends its weight in ADA’s favor.
In the immediate future, the $0.290 resistance level looms large. Clear this, and you’re staring at a robust resistance level of $0.300. Blast through that, and a bullish charge to $0.320 becomes more than a pipe dream. In an even more optimistic scenario? Well, the moon could be the limit—but let’s peg the next targets at $0.335 and possibly even $0.350.
Downward Risks: A Reality Check
While the sky may be blue, clouds exist. Immediate support hovers at the $0.278 floor. Fall through that and you could find a safety net around the $0.268 region, which also coincides with the 50% Fibonacci retracement of the upward journey from $0.2400 to $0.2899. Slipping below $0.268? That could send ADA tumbling to $0.255, or—dare we say it—even as low as $0.250.
A Glimpse at the Indicators
- 4-Hour MACD: Gaining bullish momentum, and how!
- 4-Hour RSI: Resting comfortably above the neutral 50 mark.
Key Points To Remember
- Battlegrounds for Bulls: $0.290 and $0.300.
- Safety Nets for Bears: $0.278 and $0.268.