Bitcoin Price Breaks Down Towards $7000: The Indicators Anticipating a Huge Move Coming-up
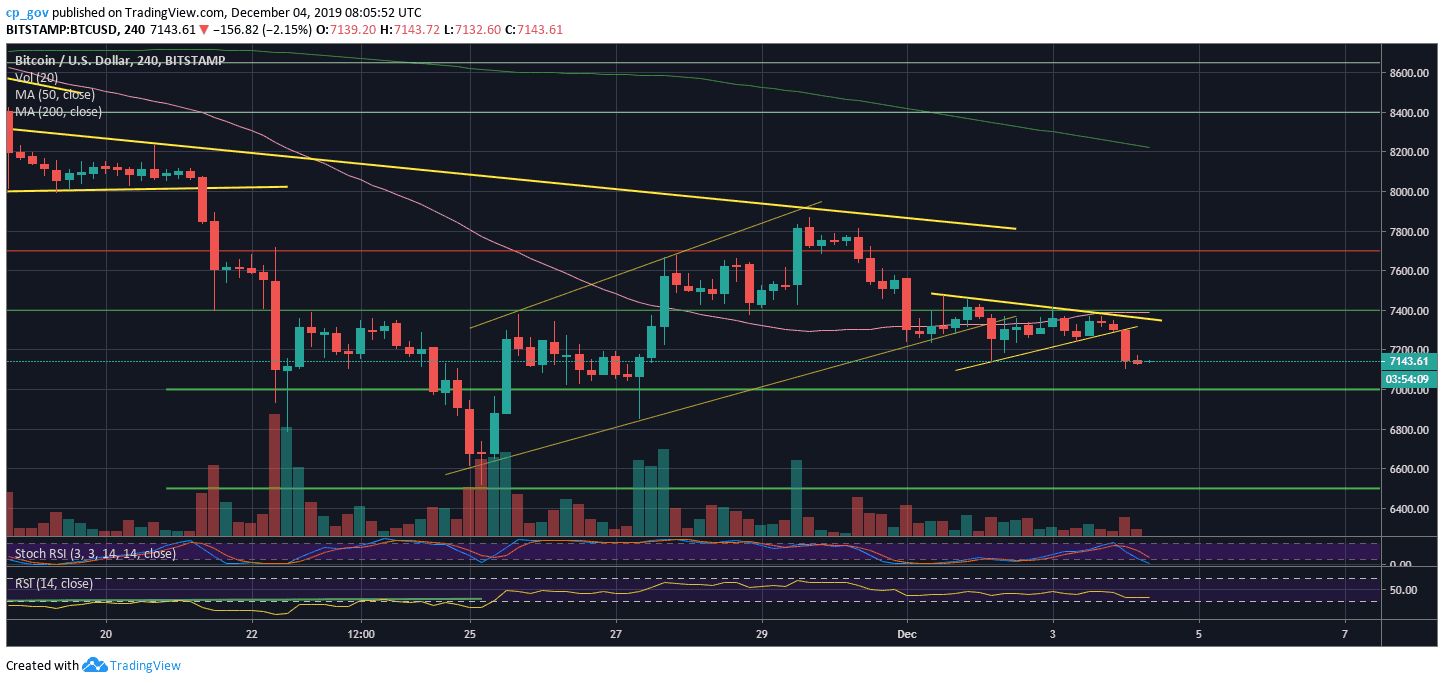
Over the past three days, Bitcoin was ‘stuck’ between the significant price range of $7300 – $7400. This range is familiar to Bitcoin, as the cryptocurrency struggled there for an extended period during November.
The last time Bitcoin broke down from that range; it resulted in a daily candlewick down to $6500, which is the lowest price of Bitcoin since May 17, 2019.
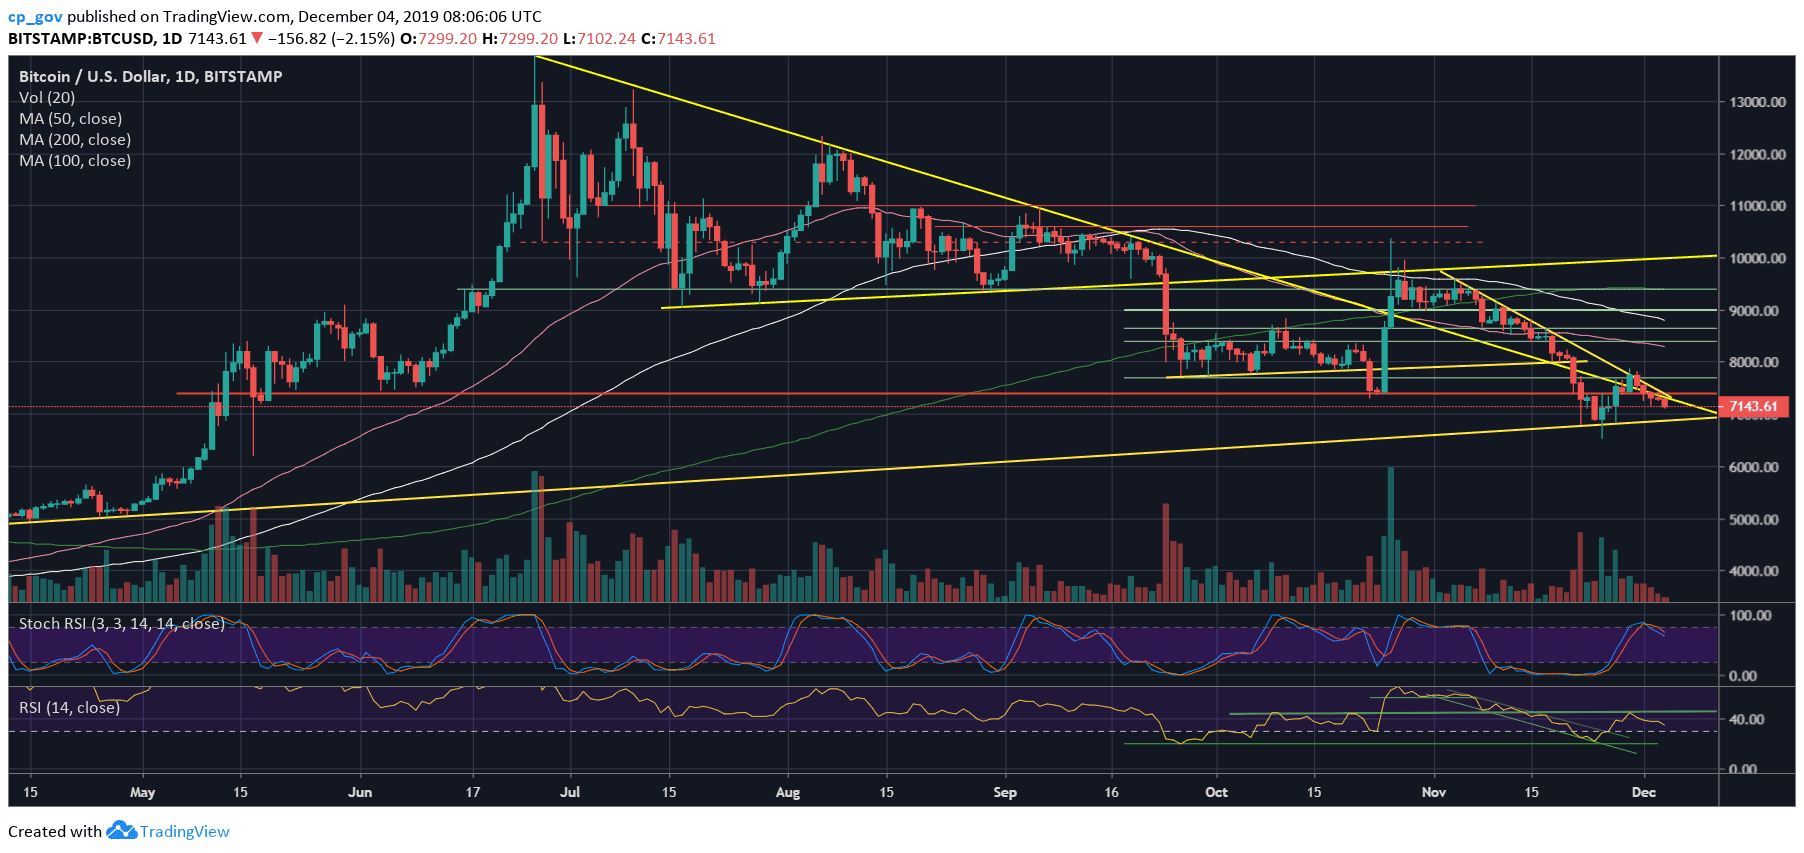
Besides, on the daily chart, Bitcoin encountered two major descending trend-lines and couldn’t overcome beyond them.
A few hours ago, Bitcoin saw a decision regarding the triangle mentioned above. Like the recent Bitcoin price action, the breakout was to the downside. As of writing this, $7100 is the new weekly low, but of course, this can change now, as you’re reading these lines.
Total Market Cap: $194.9 billion
Bitcoin Market Cap: $129.9 billion
BTC Dominance Index: 66.7%
*Data by CoinGecko
Key Levels to Watch
– Support/Resistance: Following another break to the downside, Bitcoin is facing the $7000 – $7100 support as its next support. A little below lies $6900, which is the daily ascending trend-line, started forming in the month of April. a daily candle never closed below it for more than six months.
The next level of support lies at $6800, whereas the next one is $6500, which is the lowest price of Bitcoin since May 17.
From above, following the breakdown from the confluence zone of $7300 – $7400, this had officially become the first area of resistance. In case of a break-up, which is hard to be seen now, the next resistance lies at $7700.
A real market reversal could take place, in my opinion, only when creating a new higher low above $8000.
– The RSI Indicator: Following the rejection of the significant 44-45 level just five days ago, the RSI is slowly losing momentum while going down. Unlike the indicator, the Stochastic RSI oscillator points bearish, as it entered the neutral territory following a crossover in the overbought area.
– Trading volume: Since November 22, the daily volume candles are declining over time. This is the ground for a coming-up price move, probably very soon.
BTC/USD BitStamp 4-Hour Chart
BTC/USD BitStamp 1-Day Chart
Disclaimer: Information found on CryptoPotato is those of writers quoted. It does not represent the opinions of CryptoPotato on whether to buy, sell, or hold any investments. You are advised to conduct your own research before making any investment decisions. Use provided information at your own risk. See Disclaimer for more information.
Cryptocurrency charts by TradingView.
Technical analysis tools by Coinigy.
Source: cryptopotato.com
View original post